Since the release of AppLovin MMM benchmarks – part I, interest in the new channel has only intensified.
Which is why I’m excited to release the second installment from Prescient’s visibility into trends around AppLovin —from Spend, halo effects, and BFCM recap to New Customers/CAC.
A quick recap from insights and hypothesis extracted from the data:
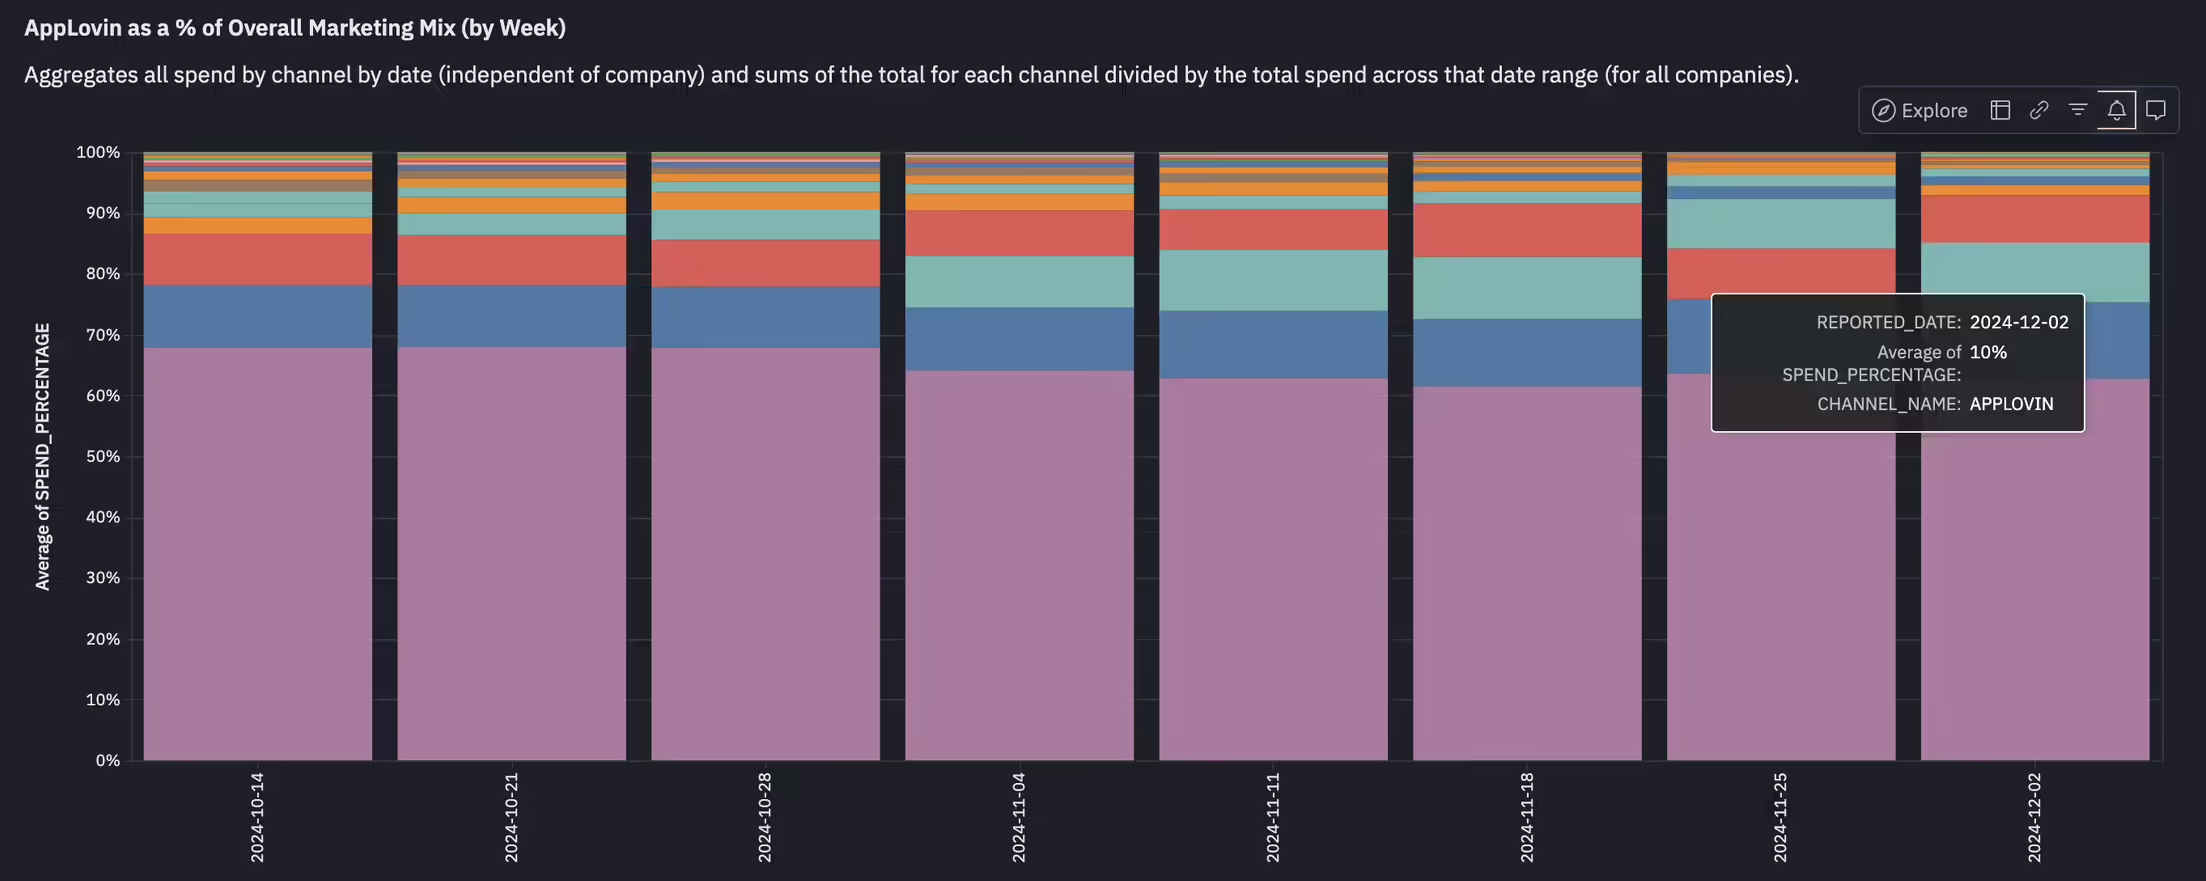
(1) Brands in the private beta continue to consistently spend a healthy average of ~10% of their weekly total budgets on AppLovin. Top brands have spent upwards of ~20%+ of their total mix.
(2) “Halo effects” have substantially improved and are on pace with channels like Google and TikTok. Halo effects were especially strong during the BFCM period, demonstrating further signs that AppLovin may be more than just a direct-response channel.
(3) While AppLovin’s percentage share of the overall media mix dipped during BFCM in favor of core channels Meta, Google, and Amazon, gross dollar spend increased substantially with general budget increases. Efficiency remained strong and exhibited even more strength against Meta on average due to the increase in halo effects.
(4) Rumored marketer concern around AppLovin retargeting old customers may have some merit in certain scenarios of rapid scaling and high spend. AppLovin MMM New Customers and CAC still appear efficient at specific levels of spend that are more in line with Google and Amazon’s share of the mix.
(1) Spend patterns
Period: Oct 14 – Dec 8, 2024
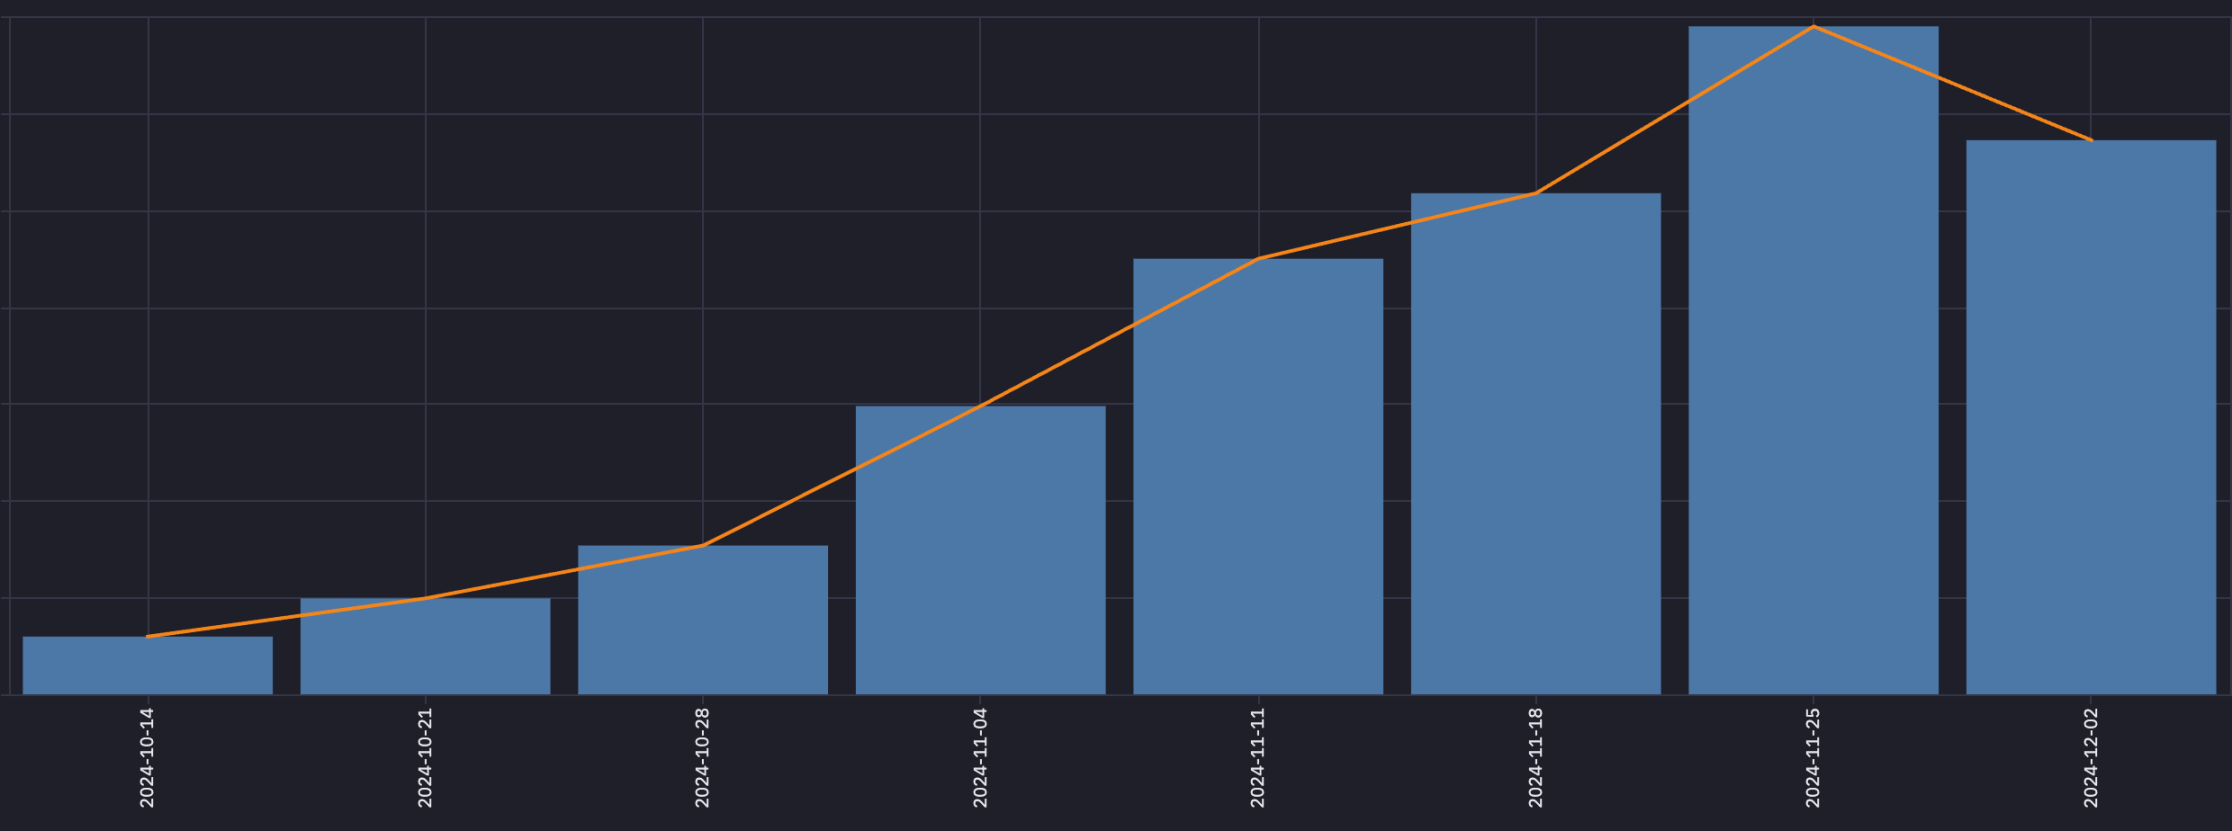
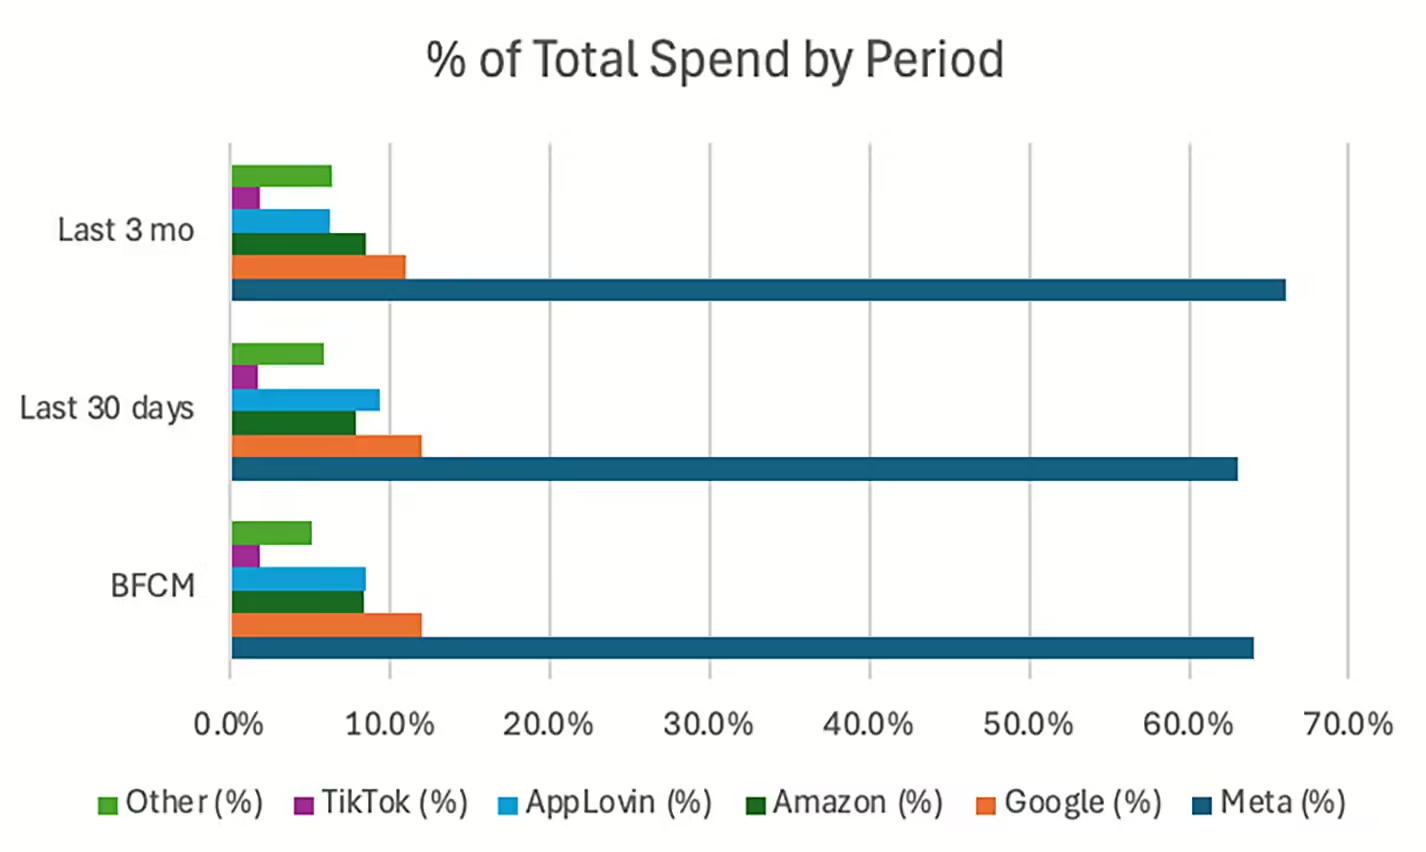
The story has not changed too drastically as Meta remains dominant with 60%+ of spend, with AppLovin avg. spend consistently around the ~10%. The BFCM period (more below) did see a slight mix shift back to the core channels of Google and Amazon, although gross dollars spent increased for all channels leading up to and during that period. The overall budget shifts that were seen came at the expense of longer-tail channels (e.g. podcast, influencer/affiliate, pinterest, TV). Cumulative WoW spend on AppLovin also has accelerated at a weekly CAGR of ~22% within this measured cohort.
(2) Halo effects
In AppLovin MMM benchmarks – part I, we looked at halo effects, which are delayed impacts from seeing an ad to an eventual conversion, and noted that AppLovin had the lowest halo effects of the core channels. However, I also acknowledged that it was still too early to jump to conclusions.
“Also, halo effects can take time to develop (often up to at least 28 days), and these weekly cohorts may shift as more time and potential conversions come in.”
– AppLovin MMM benchmarks – part I
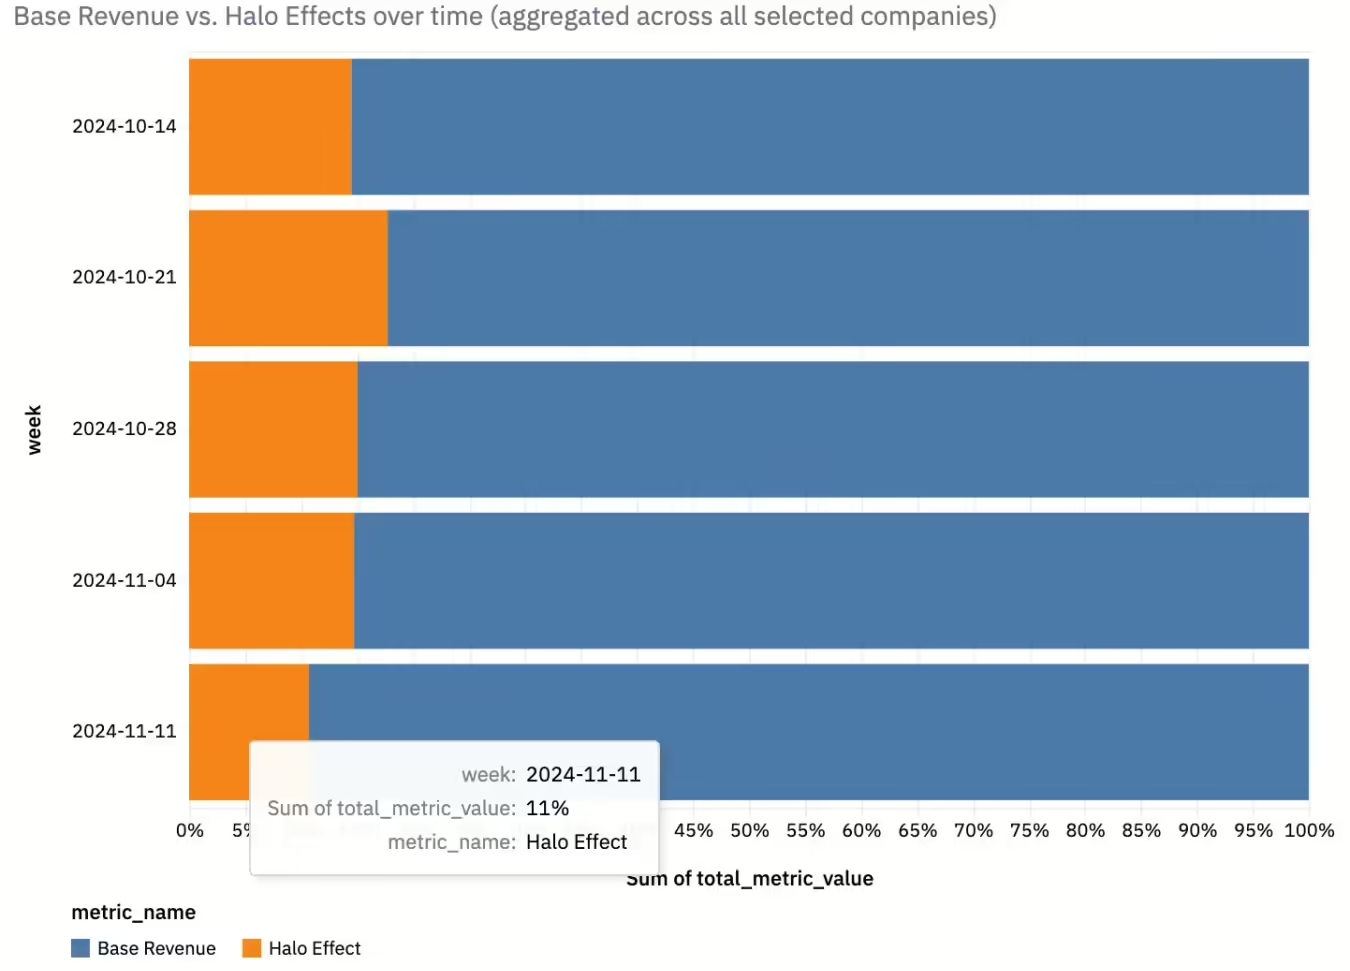
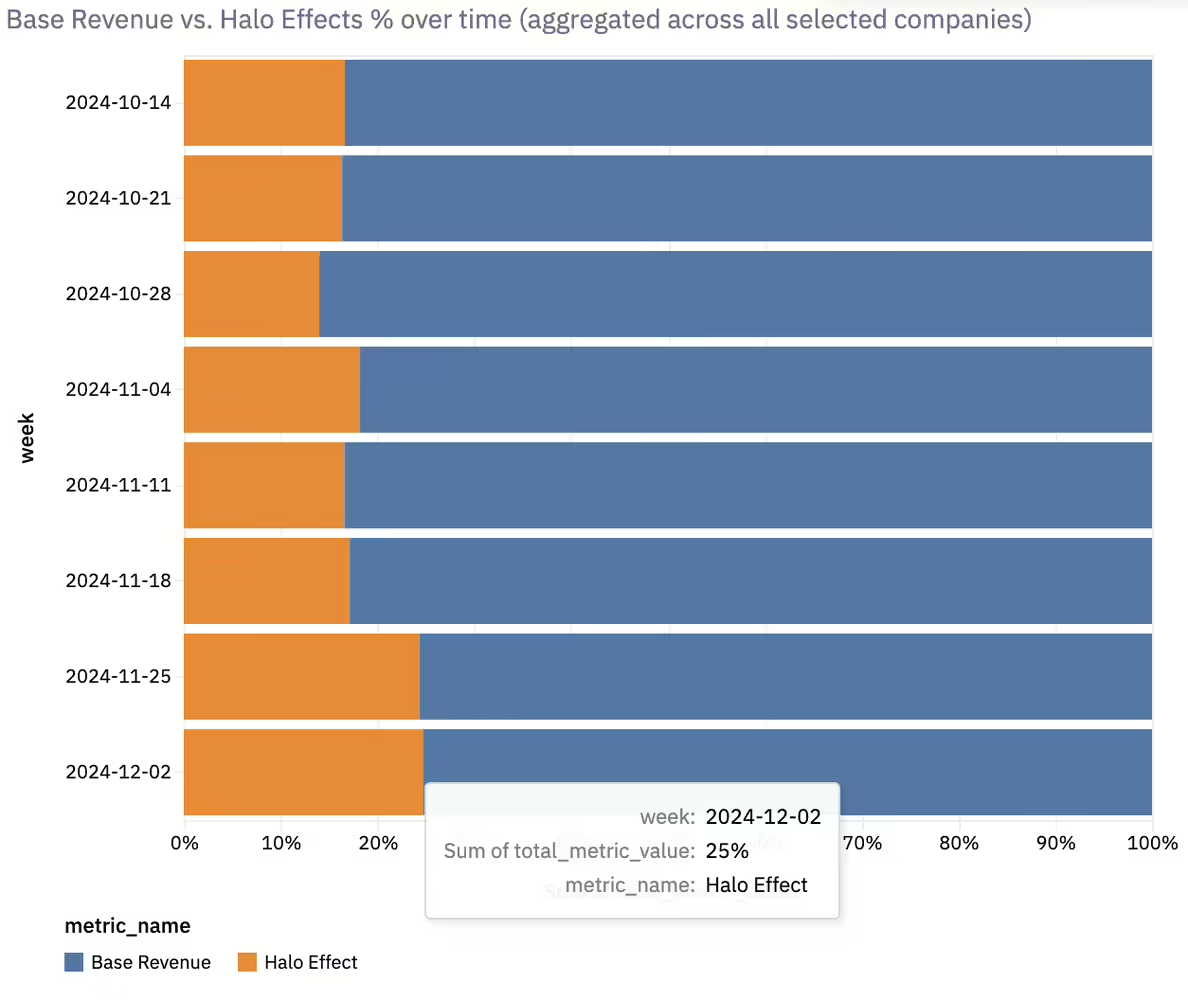
As anticipated, halo effects by weekly cohort have changed—and more favorably for AppLovin.
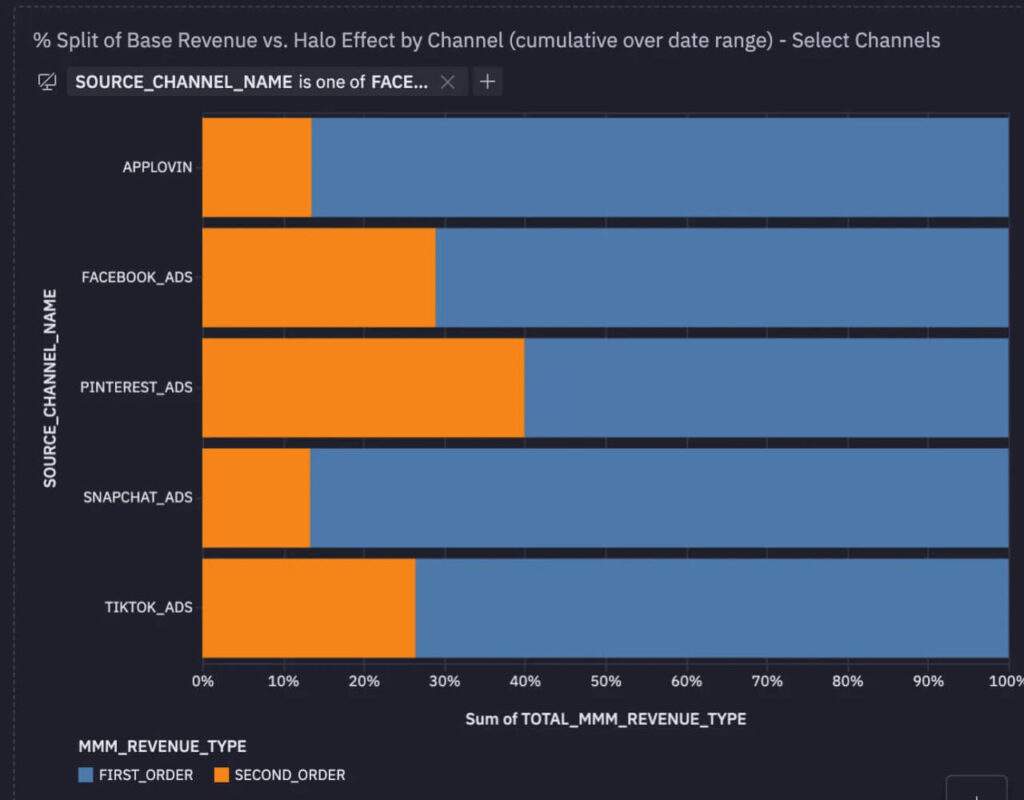
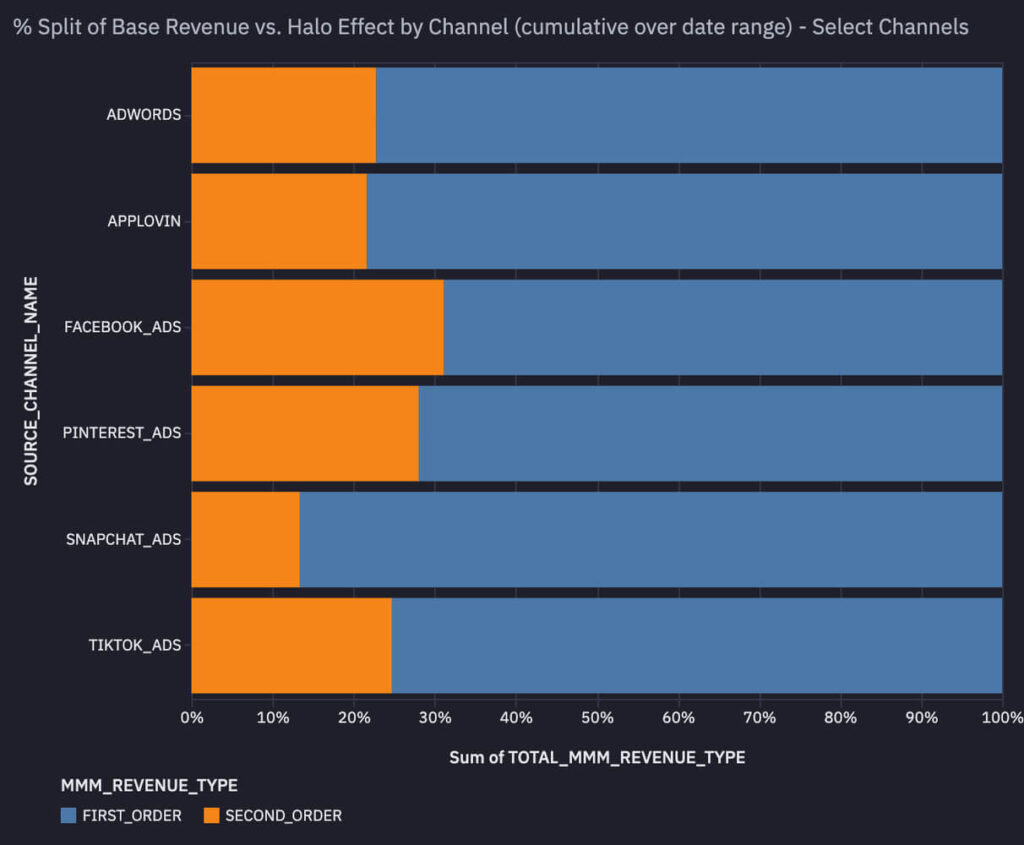
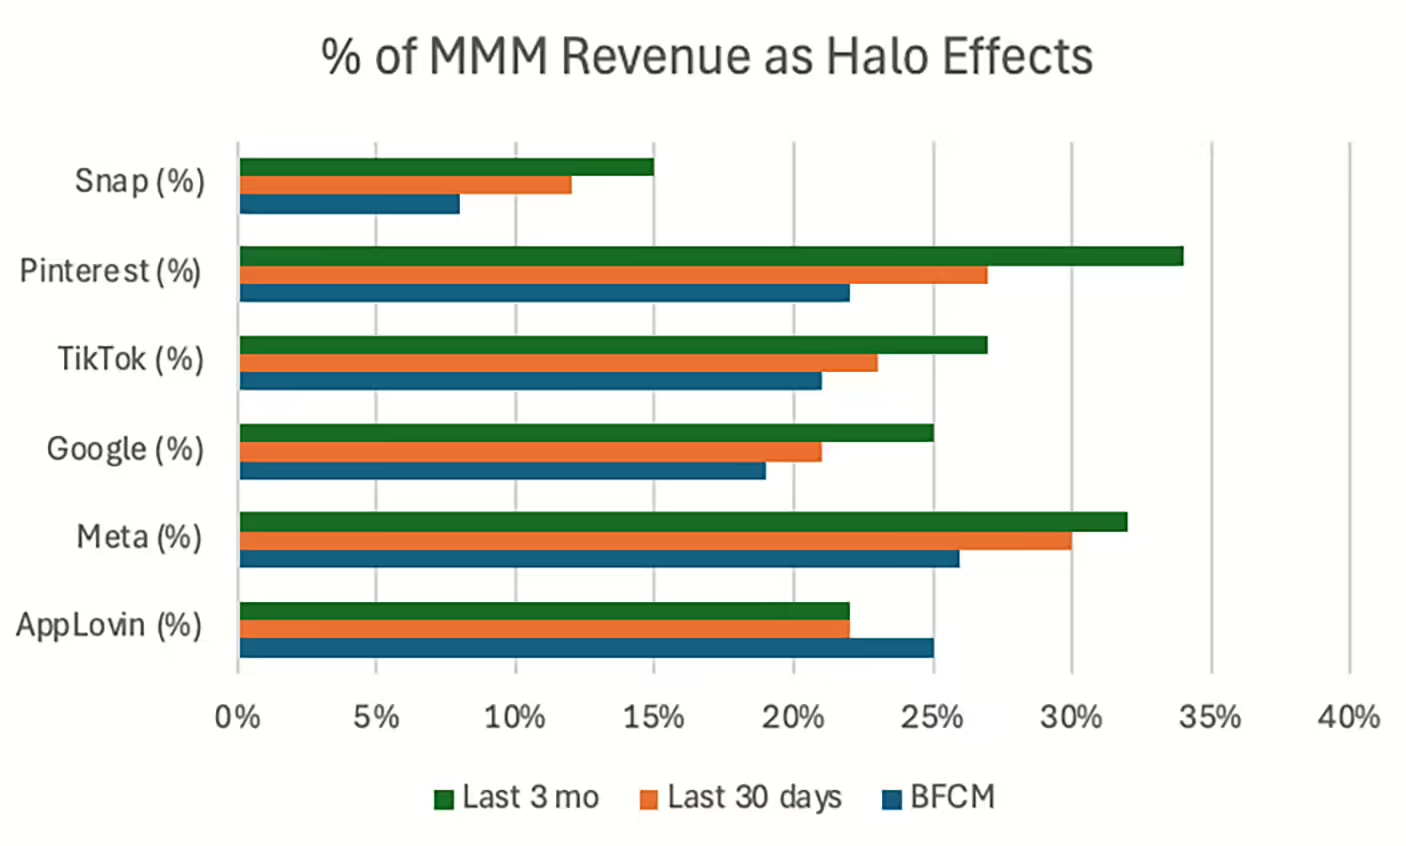
While AppLovin’s position in the overall range is still lower than Meta (~30%) at ~22%, it is now in line with Google (~23%), just behind TikTok (~25%), and marks an impactful rise from ~15% in the last analysis. These halo effects appear to be accumulating and were especially pronounced during BFCM (more details below).
From a marketing perspective, this makes sense.
AppLovin had been serving many impressions leading up to the BFCM period, and ultimately the delayed impact of the spending may have led to the increased halo effects we’re seeing in later periods, especially during a period of high intent.
From a statistical modeling standpoint, this also makes sense.
Even older cohorts are now showing an increase in helo effects, which can happen as the model’s confidence increases with new data.
Halo effects are meant to redistribute credit from more bottom-of-funnel channels to acquisition/awareness channels, which is one of the core reasons Meta has become even more dominant with its focus on upper funnel and probabilistic measurement and optimization.
While it’s encouraging to see this level of halo effects over time, there is a catch.
The reality is many marketers, especially as AppLovin opens to general availability, are very used to measuring performance on a click/pixel basis and may not be able to ascertain the credit derived from these lagged effects.
Meta has done a great job satisfying many forms of measurement, from embracing top-of-funnel probabilistic reach testing through incrementality testing and MMM to more direct-response approaches that can be measured by MTAs. Google is rumored to also be embracing more of the same. AppLovin, undoubtedly, with its partnerships with third-party measurement providers like Prescient, is taking an early and earnest focus to get ahead of these credit allocation challenges.
BFCM recap
Period: Nov 29 – Dec 2, 2024 (BFCM)
By all accounts, brands had a very successful run during BFCM. Within the AppLovin-measured cohort, overall spend per day on tracked marketing channels was up ~94% (vs. the 30-day period) and ~200% (vs. the last 90-day period). For AppLovin specifically, average spend per day increased ~75% (vs. the 30-day period) and ~300%+ (vs. the 90-day period). The implied max spend on AppLovin per day for a brand increased ~20% (>$150k/day in spend), although the median and average spend per day per brand dropped ~-7% (vs. 30-day) yet remained ~27% higher (vs. the 90-day average).
What can we take away from this period?
- While AppLovin’s share of spend dropped during BFCM (~-12% vs. the 30-day period), brands spent more absolute dollars on AppLovin during the period. Most dollars went to core channels like Meta, Google, and Amazon, while TikTok continues to be a low but stable part of the mix. Budget shifts continue to come from longer-tail channels (e.g., podcast, influencer/affiliate, pinterest, TV).
- High-spending brands continued to spend a greater share on AppLovin. Across the 30- and 90-day comparison windows, the average spend on AppLovin had increased significantly, but scale continues to play into these results as the median spend from a 30-day comparison dropped (although it is still well up on the 90-day view). This median behavior is not surprising, with newly onboarded and lower-scale brands unlikely to take on more budget risk during the BFCM period.
Outside of the more tactical spend-related behavior, the MMM-based results demonstrate a new, but somewhat expected, trend developing around increased halo effects from AppLovin. From the Part I analysis, we initially observed low halo effects from AppLovin, although with the caveat that, by nature, halo effects may be delayed, especially with a new channel and as brands scale spend.
With respect to halo effects on BFCM:
- AppLovin’s halo effects nearly matched the level of Meta (~25%) and surpassed all other core channels like Google and even TikTok. It’s the only core channel in this period to have seen an increase in halo effects relative to the 30 day average. Given the short time frame, this indicated that a lot of the direct-response credit was likely not given to AppLovin but should have been (e.g., someone may have seen an AppLovin ad but converted elsewhere, such as on Google or Amazon). From a modeling standpoint, this is a positive trend; however, the measurement is only as good as the widespread ability to track these Halo impacts.
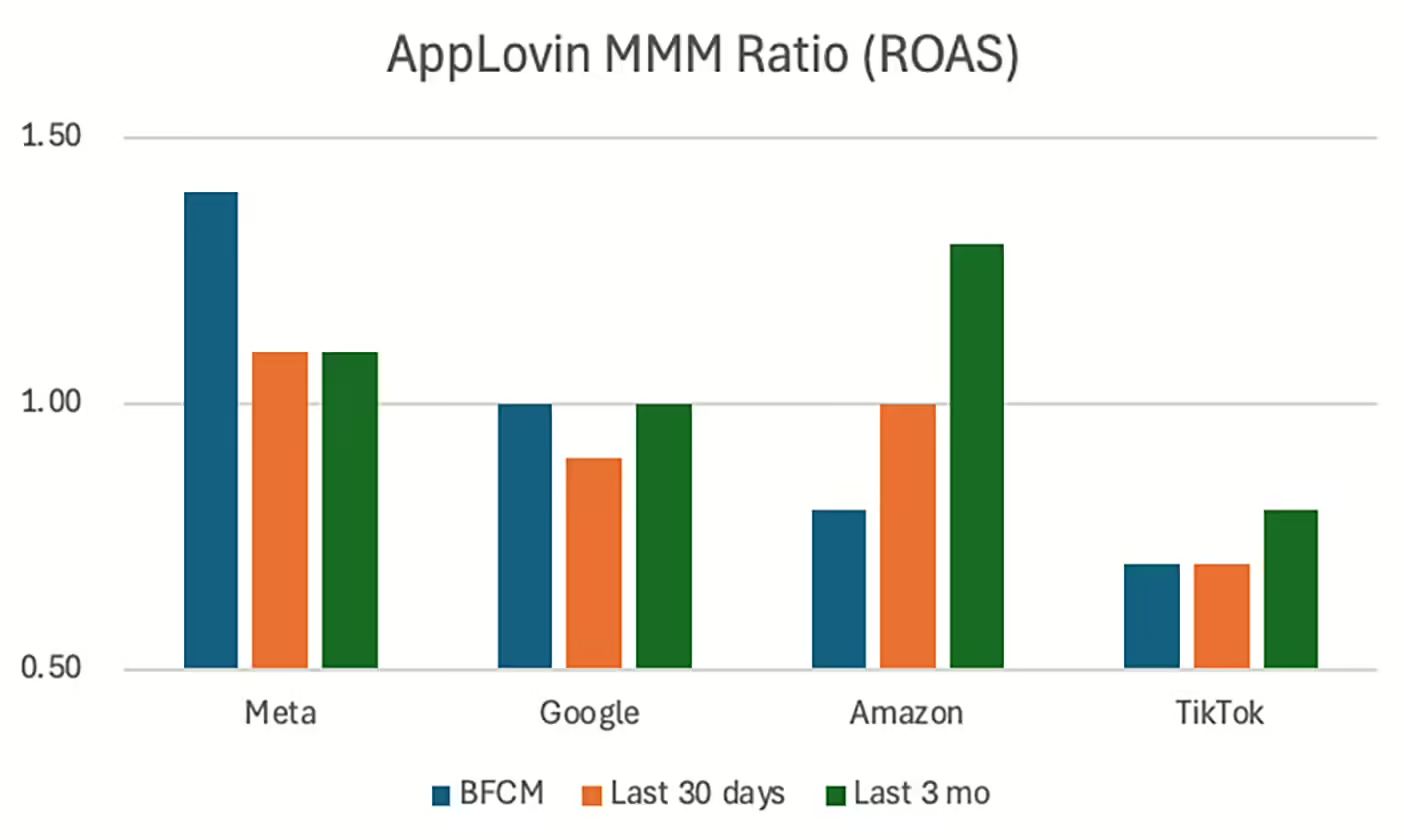
- As a result of the increased credit from halo effects, AppLovin actually became even more efficient on an MMM ROAS basis on average than Meta (although at a much lower scale), on par with Google, but less efficient than Amazon (unsurprising given Prime Day) and TikTok (which operates at a much lower scale).
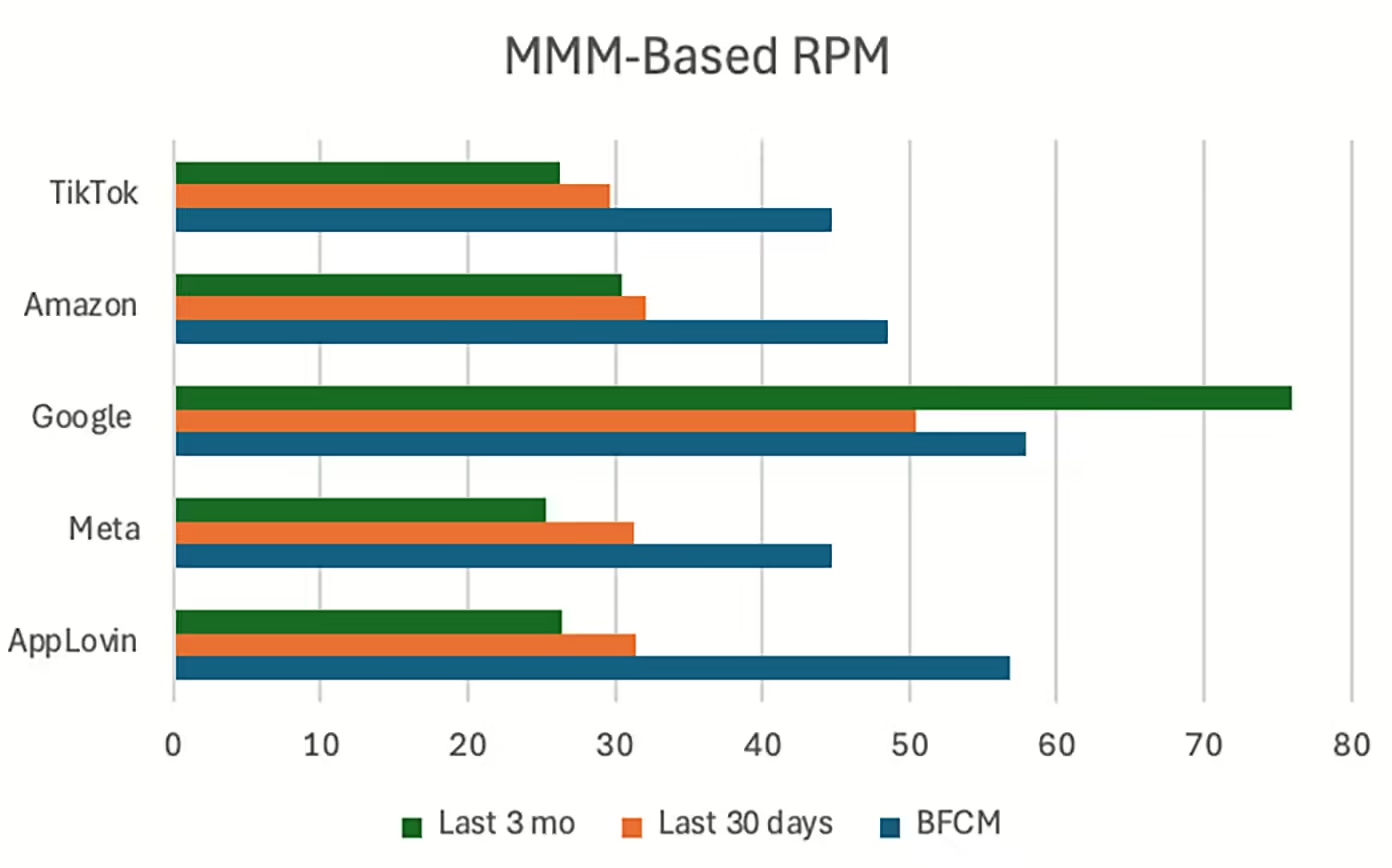
- MMM-based RPM (revenue per 1,000 impressions), a proxy for revenue efficiency on impressions, rose for all core channels during BFCM. AppLovin had the largest increase (~+80% vs. the last 30 days), signaling that its users may come from higher-purchasing demographics (as often cited by AppLovin and corroborated by direct-response-based solutions like post-purchase surveys).
New Customers / CAC
For those immersed in the niche world of eCommerce, industry gossip has become a form of social currency. AppLovin soundbites, in particular, have emerged as the latest buzz. One of the more common threads as of late is that AppLovin may be targeting the same customers repeatedly as campaigns scale. Anecdotes aside, the data does suggest some potential areas of truth to this in certain scenarios.
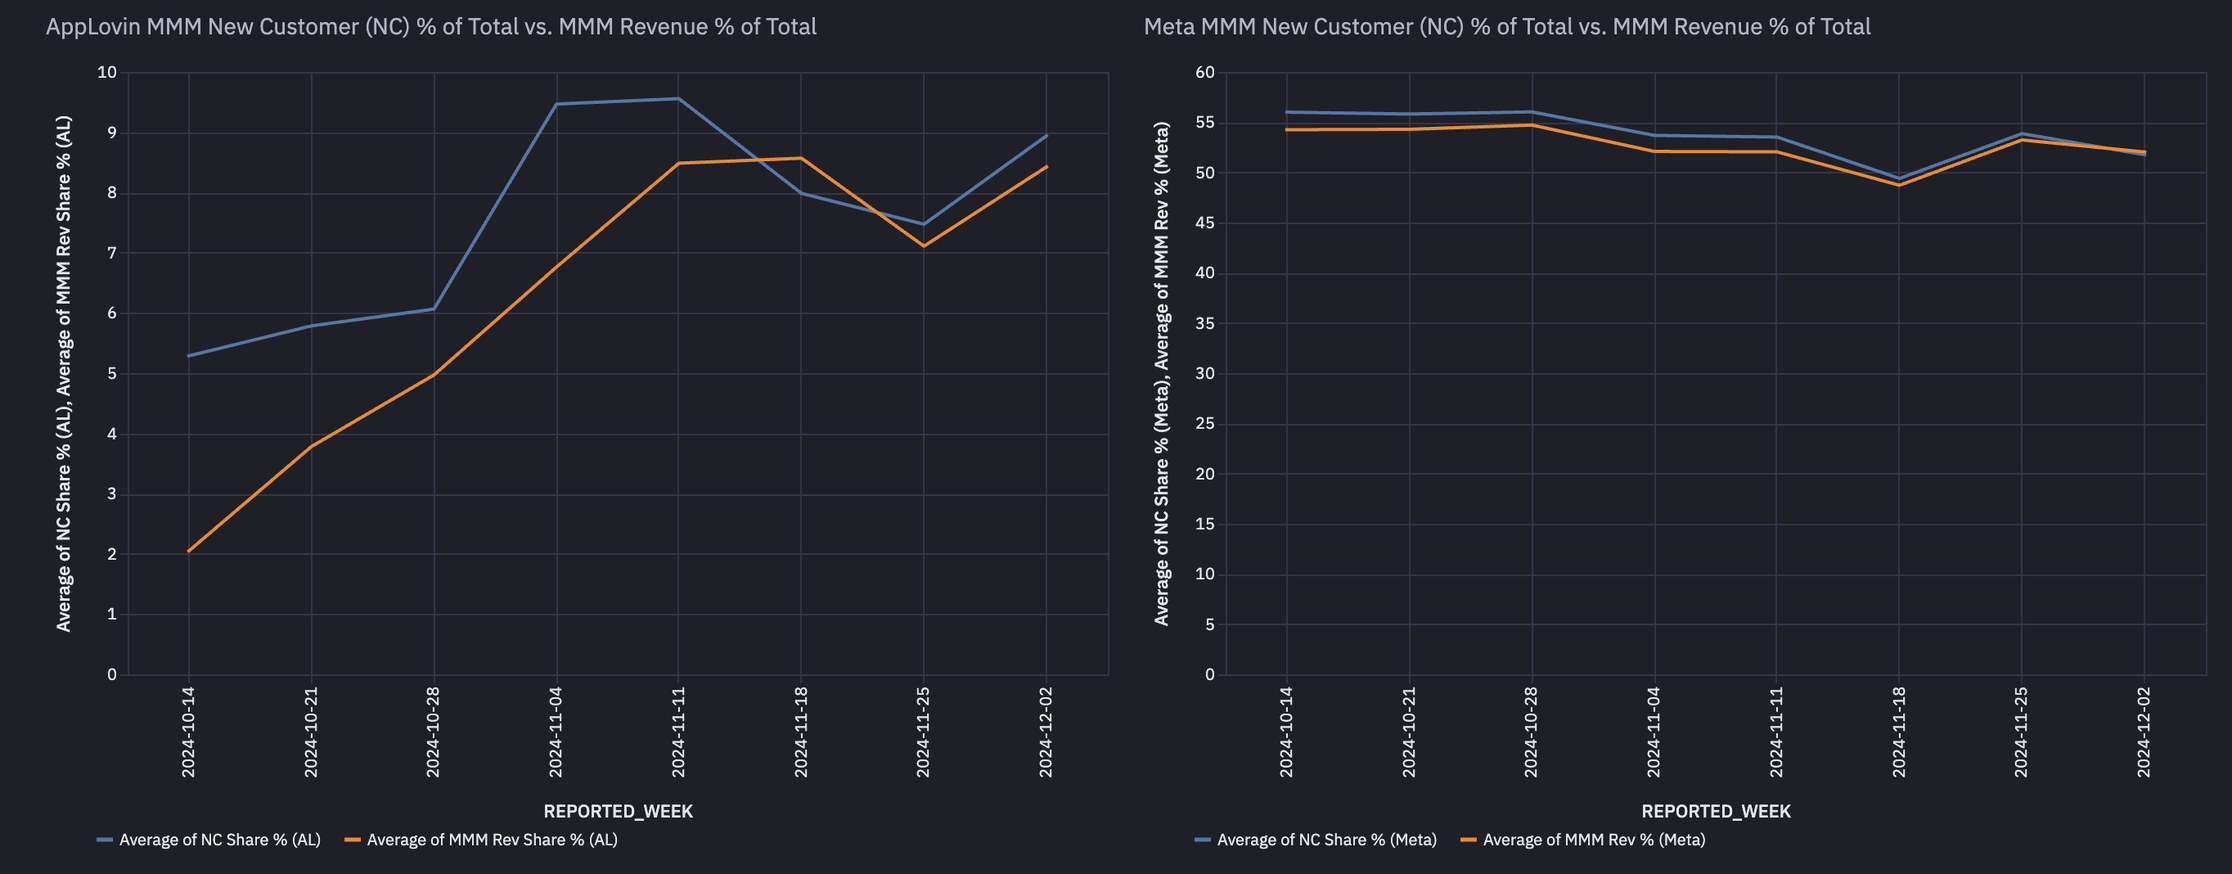
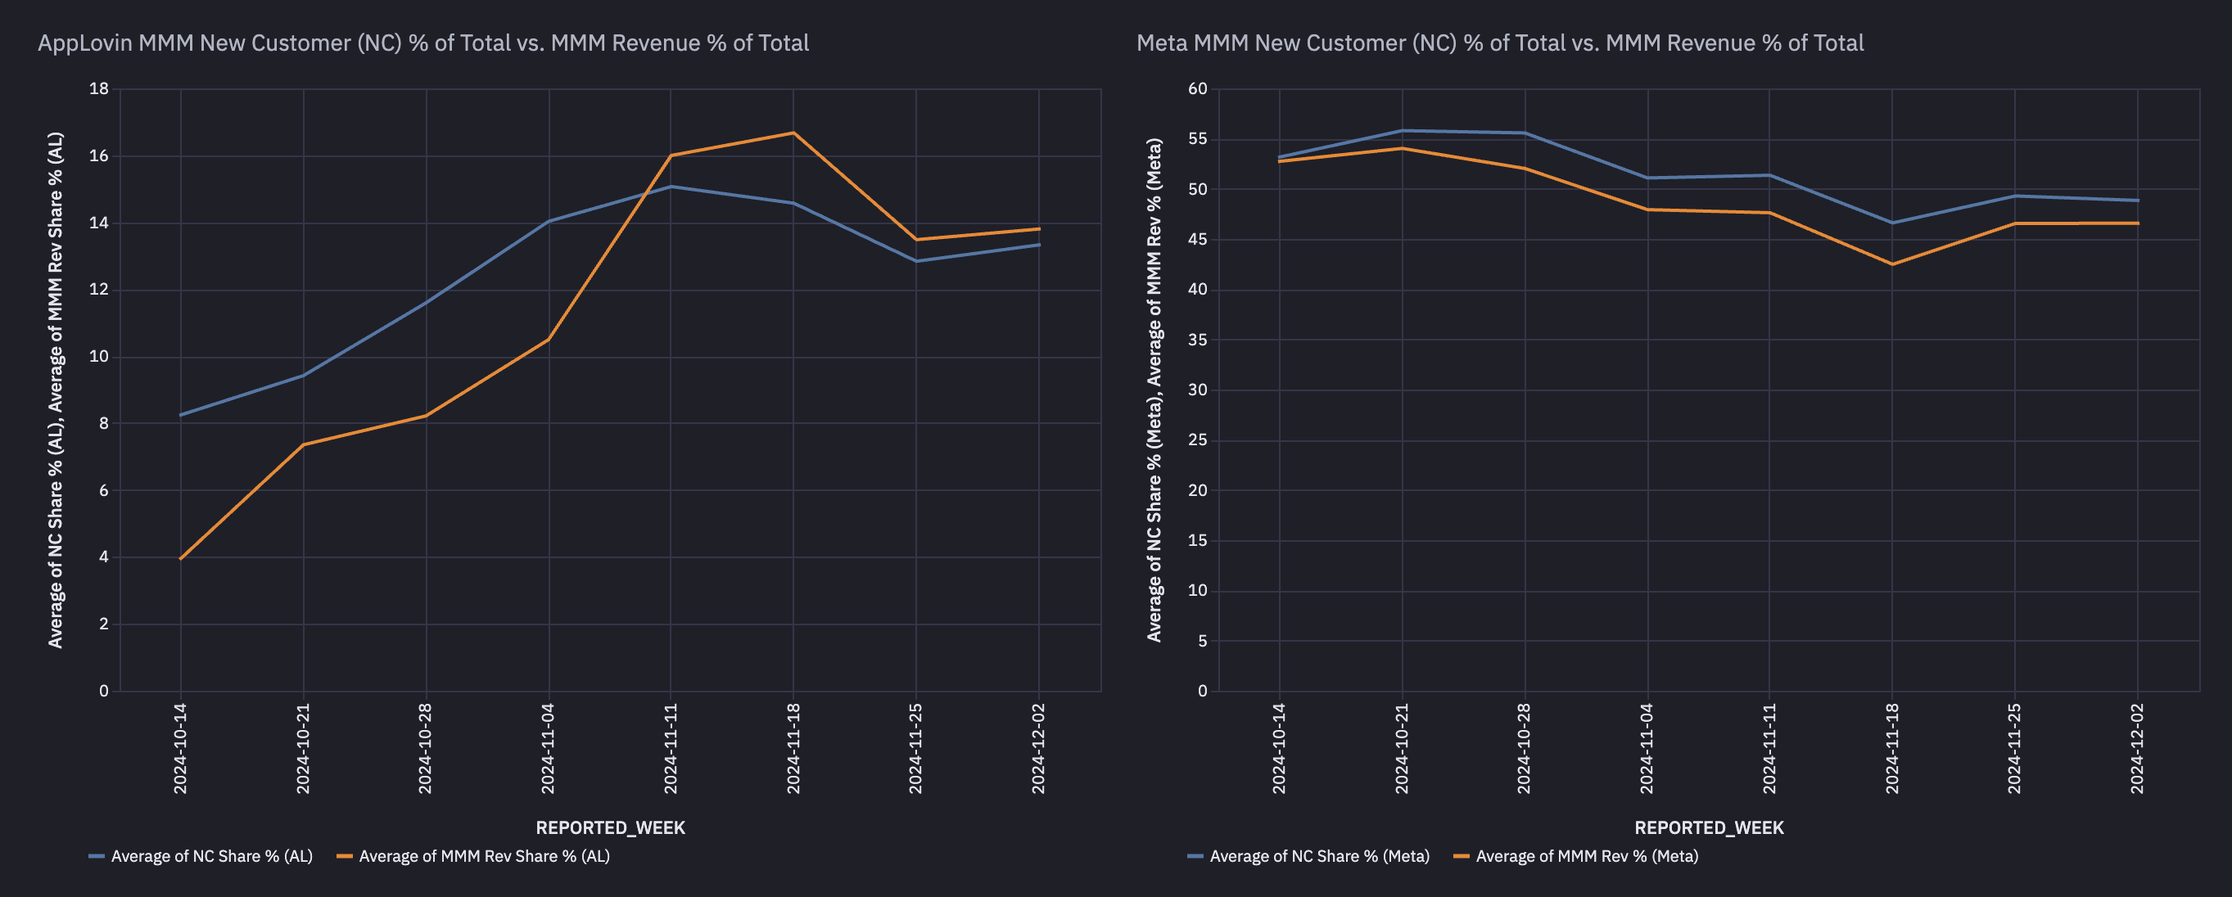
From an MMM perspective, we can look at Modeled New Customers and CAC vis-à-vis other channels to test the theory. We can also compare the % of MMM New Customers generated versus the % of MMM Revenue generated to understand if there’s a noticeable discrepancy between the trend of these two target outcomes. For instance, if the % of MMM New Customers < the % of MMM Revenue in a given period, this could signal that transactional revenue (driven by paid media) may be coming from sources other than new customers.
On average, the trends look generally favorable for AppLovin, as more new customers are generated relative to revenue—implying the channel is potentially stronger at driving new customers than other channels. Meta appears tightly coupled in this relationship, suggesting other channels outside of AppLovin and Meta are likely taking too much credit for new customer acquisition.
However, I did say certain scenarios could look different.
When recutting the cohorts to focus on the top 25% spenders, AppLovin’s new customer credit starts off strong but shows signs of reversion over time. For Meta, this relationship remains more favorable, with more acquisition credit allocated to the channel for new customers. These top-cohort brands are spending on average ~17% on AppLovin as their second-highest marketing channel outside Meta.
This narrative aligns with anecdotes about starting off with strong acquisition, followed by potential new customer saturation as these players push to scale.
Is leakage to potential repeat customers a bad thing?
It all comes down to the ability to scale revenue while keeping Customer Acquisition Cost (CAC) efficient at different points of spend.
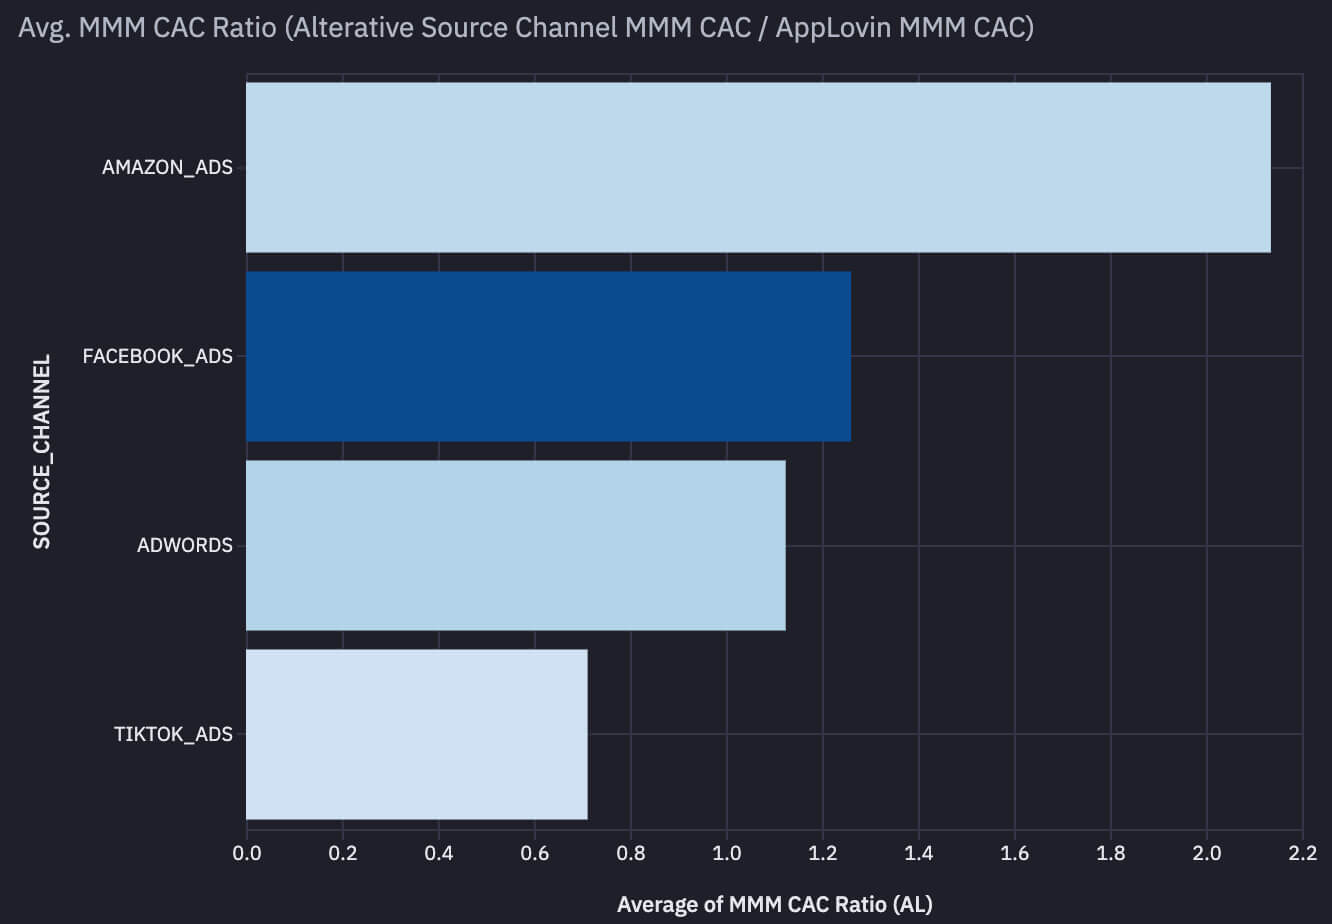
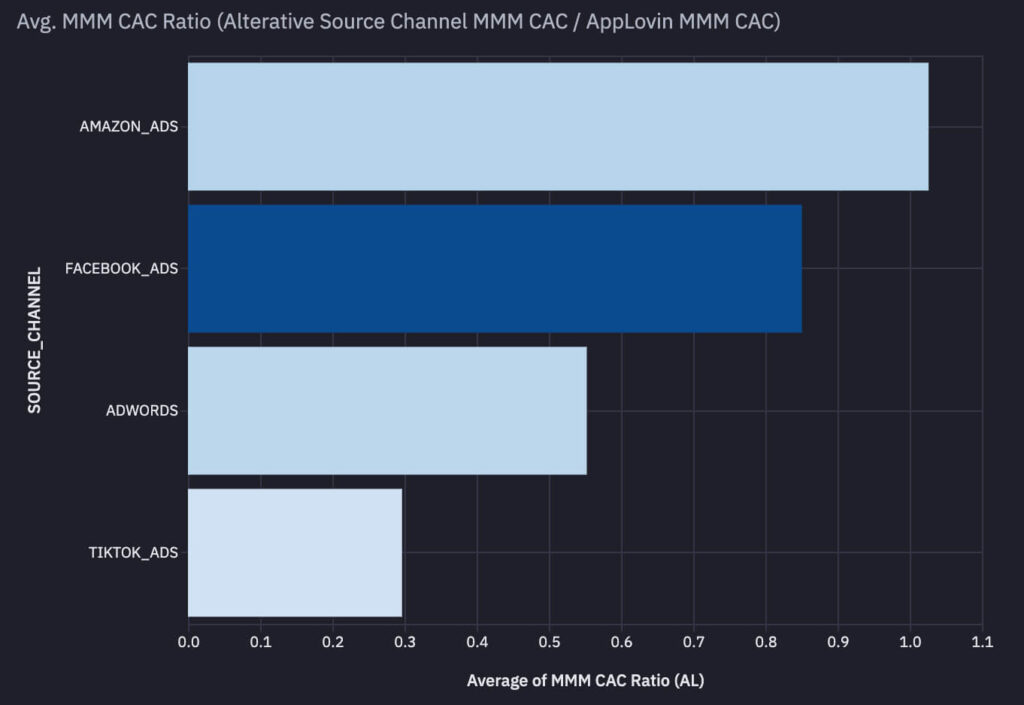
When zooming back out to the average customer, AppLovin is still more efficient from an MMM CAC Ratio perspective than most of the core channels. However, for the top 25% of spenders on AppLovin, the relationship flips in favor of the core channels. This suggests that there is currently a happy medium of relative spend % and a point of saturation when brands scale too aggressively into the channel relative to their marketing mix.
There are also other potential factors at play.
We also know from partnering with the AppLovin team that the machine-learning algorithm that powers its network can be sensitive to stark changes (like a rapid increase or decrease in budget). And given there is no unique email or UID identifiers in the system, there are bound to be cases where users may be retargeted if they are seen as higher propensity buyers and if certain budget limits and efficiency targets around ROAS and or CAC are put in place.
We also have also already seen that MMM RPM may be higher for AppLovin than Meta, which may lead to a lower number of new customers but with a higher average order value (which can also contribute to that Revenue/CAC divergence).
What can we take away from this analysis?
As premised in the first analysis, AppLovin results will continue to evolve as brands rapidly test the new ad platform and as measurement providers like Prescient capture more data to form higher-confidence signals. The increasing halo effects and efficiency on ROAS and CAC during a prime buying season are compelling. However, it’s worth keeping an eye on where this channel may saturate, as we’ve now seen brands hit limits on incremental ROAS and new customers.
It’s still very early, but if AppLovin can establish itself as a consistent top-4 channel in the marketing mix as the program matures, the trend will be hard to ignore.
Notes on methodology and dataset:
- Primary dataset evaluated from 10/14/24 (the start of Part I analysis) – 12/8/24. BFCM period evaluated from 11/29/24 – 12/2/24. The last 30 days and 3 months are retroactive from 12/8/24.
- All modeled results are derived from Prescient’s MMM (Marketing Mix Model) from a sample of customers who are active on AppLovin.
- Customers range from beauty, supplements, accessories, apparel, technology, and home goods eCommerce brands that operate on Shopify and Amazon.
- Marketing channels displayed are at least 1% or greater of the marketing mix.
- (Google) Adwords is inclusive of Youtube, PMAX, Non-Brand and Brand campaigns.
- Halo effects = Second Order revenue derived from specific campaigns, also known as the delayed effect from awareness to conversion. Halo effects help re-distribute credit from the bottom to top of funnel marketing channels and campaigns.
- Base revenue = First Order revenue derived from specific campaigns, most akin to last-click but probabilistically measured.
- MMM ROAS = Marketing Mix Model calculated Return on Ad Spend as measured by Prescient.
- MMM New Customers = Marketing Mix Model calculated New Customers (across DTC and Amazon where applicable) as measured by Prescient.
- MMM CAC = Calculated Spend / MMM New Customers
- MMM RPM = Modeled Revenue per 1000 impressions as measured by Prescient. Modeled Revenue includes Base (first order) and Halo effect (second order) revenue.

Will Holtz has spent over a decade working at the intersection of data, eCommerce, and marketing. As VP of Strategy & Operations at Prescient AI, he leads analytics efforts and has authored widely-referenced benchmark reports. These reports are used by brands, investors, and operators to understand how marketing dollars drive growth across channels. Will earned his MBA from The Wharton School, where he focused on Marketing Analytics, after starting his career in finance at Morgan Stanley and Soros Fund Management. He’s passionate about turning complex data into insights that help brands and investors make better decisions.

