




Understanding a point of diminishing returns in marketing
While the concept of diminishing returns is sound, the real-world application is far more complex.
Linnea Zielinski · 14 min read

The point of diminishing returns is the level of spend at which each additional dollar returns less than the dollar before it: in marketing, the budget level where marginal ROAS starts to fall even though total revenue still grows. The law of diminishing returns is the pattern, the point is where the pattern starts, and saturation is the end state. The law predates paid media by two centuries: classical economists such as Turgot, Malthus, and Ricardo used it to explain why adding labor to a fixed plot of land eventually yields smaller harvests.
Imagine a marathon runner moving through a 26.2-mile course. Conventional wisdom suggests their energy will steadily diminish over time—starting strong, maintaining a decent pace through the middle miles, and then gradually slowing as fatigue sets in during the final stretch. This is the classic diminishing returns curve we all expect to see, potentially with a clear point of diminishing returns as their energy flags.
But any experienced runner knows the reality is far more nuanced. Runners often get a “second wind” several miles in. The enthusiastic crowd at mile 20 might temporarily boost their pace. A fellow competitor might spark a competitive surge. Marketing campaigns work in surprisingly similar ways. While the concept of diminishing returns is fundamentally sound, the real-world application is far more complex. For marketers, that may mean you’re missing out on ROI by expecting the smooth curves of textbooks instead of the twists of reality.
Key takeaways
- The point of diminishing returns is where the marginal return on the last increment of spend stops rising and starts to fall, well before extra spend loses money.
- You find it by comparing marginal return, not average return, across budget steps: if the next step adds less than the previous one did, you have passed it.
- In paid media the curve is rarely one smooth arc. Audience thresholds, creative refreshes, and platform learning phases create several efficiency peaks, so the first flattening is not always the point.
- Before cutting a campaign that looks saturated, check what it feeds: retargeting pools, branded search, and other channels through halo effects.
The basic concept of diminishing returns in marketing
The idea of diminishing returns comes from economics. This principle states that after a certain point, adding more of one input while keeping other production factors constant yields progressively smaller increases in output. (You’ll see this called both diminishing returns and diminishing marginal returns.) In marketing terms, this translates to: the more you spend on a campaign, the less additional revenue each new dollar generates past a certain point.
The traditional diminishing returns curve in marketing looks something like this:
Initial spending generates substantial returns as you reach the most receptive audiences
Mid-level spending continues to drive growth, but at a decreasing rate because you’ve already hit the point of diminishing returns
High-level spending yields minimal additional returns as the most convertible audiences have already been reached
This concept forms the foundation of marketing efficiency metrics like ROAS (Return on Ad Spend) and helps marketers determine optimal budget allocation. Intuitively, it makes sense—you can’t keep increasing your marketing budget infinitely and expect the same level of returns. Well, except it’s a lot more nuanced than that, and the law of diminishing returns doesn’t translate perfectly to marketing.
Why marketers are already familiar with this concept
If you’ve worked in marketing for any length of time, you’ve encountered diminishing returns, whether or not you used that specific term. You’ve likely:
Noticed how your best-performing campaign started delivering less impressive results as you increased spend
Observed click-through rates decline as ad frequency increases (a 2018 study of 5.8 billion display impressions across 158 advertisers found exactly that, with the steepest drops for repetitive campaigns and heavy spenders)
Seen conversion rates drop when scaling audience targeting beyond your core demographics
Watched CPAs (Cost Per Acquisition) rise as you push campaigns beyond optimal spending levels, the diminishing marginal returns that Google's Meridian MMM documentation (2026) treats as the default shape of every channel's response curve
Platform dashboards often visualize this effect through saturation curves or efficiency metrics. We use saturation curves in our dashboard, too. Budget allocation discussions inevitably circle around the question: “At what point does additional spend on this campaign become inefficient?”
This intuitive understanding influences many marketing decisions, from setting campaign budgets to determining when to launch new creative or target different audiences.
How to find the point of diminishing returns in marketing
To find the point of diminishing returns in marketing, compare the marginal return of each budget step with the step before it, not the campaign's average return. The point is the spend level where marginal return peaks and starts to fall; a spend test or an MMM response curve locates it for each campaign.
What the diminishing returns curve looks like
With spend on the x-axis and revenue on the y-axis, the curve has three regions. It rises steeply while the campaign reaches its most receptive audience and the platform's algorithm is still learning. It bends when revenue still grows but each added dollar buys less than the last. It flattens when frequency is so high that extra spend adds nothing, and occasionally turns down.
The bend is the point of diminishing returns, the flat stretch is saturation, and the downturn is negative returns, which is uncommon in paid media. The curve belongs to a campaign, not a channel, and a fitted curve is often not one smooth arc, for reasons the next sections cover. Curve shapes (Hill, S-curve, linear) and calibration are covered in our guide to MMM saturation curves.
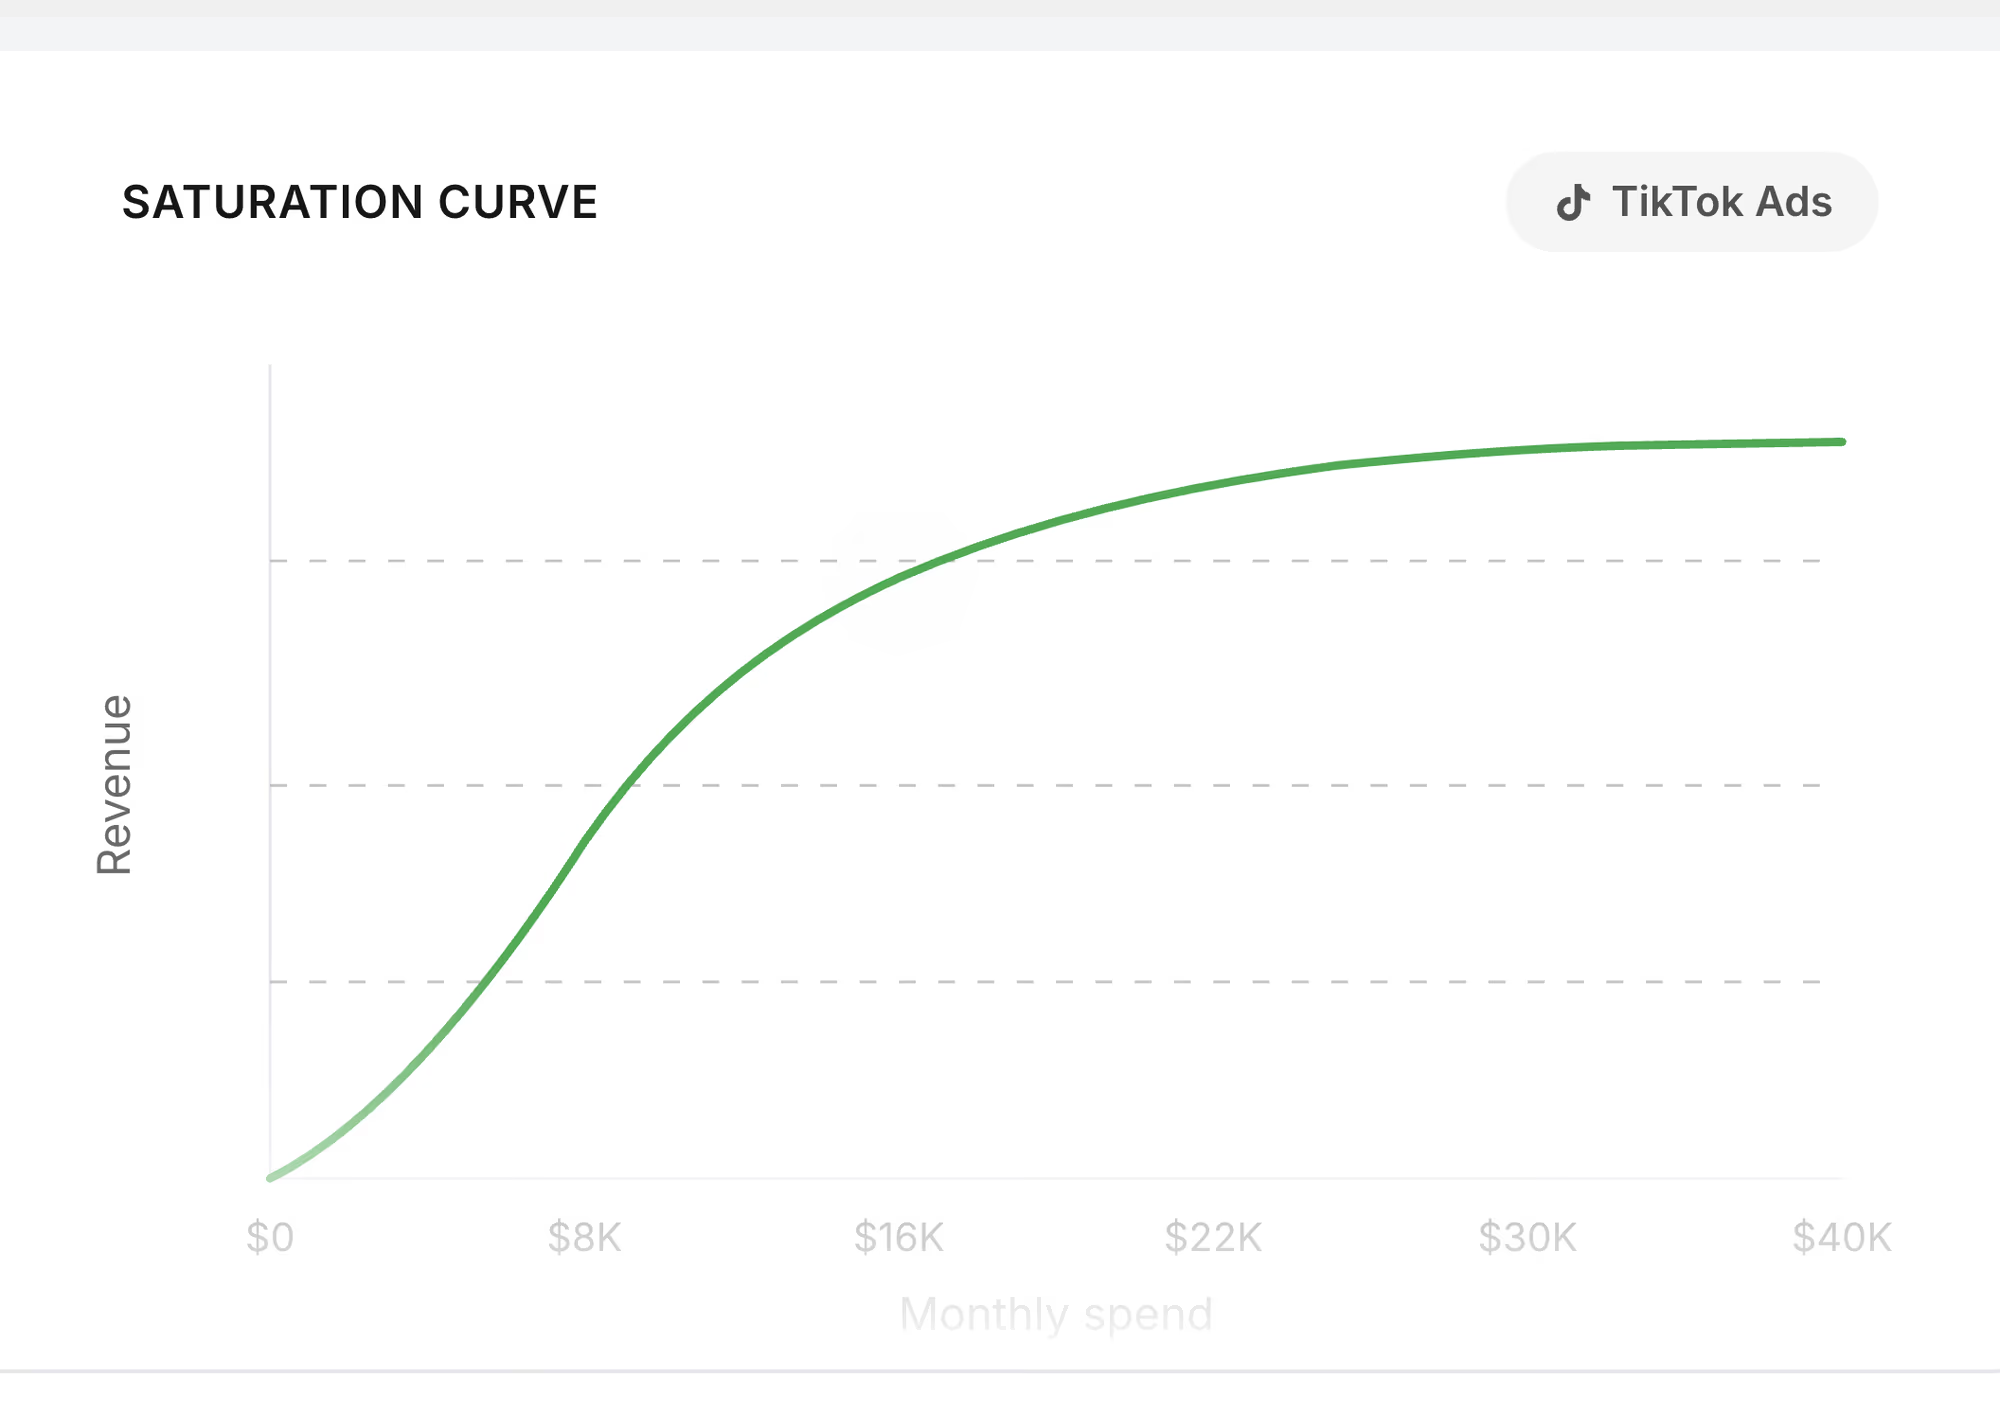
A per-channel saturation curve. The point of diminishing returns is where the slope starts to flatten, not where revenue stops.
Three steps to find the point for one campaign
- Measure marginal return, not average return. Marginal return per added dollar is the incremental revenue from the last budget increase divided by the incremental spend. Average ROAS hides the drop; marginal ROAS exposes it, and that guide covers the formula and its pitfalls.
- Step the budget and record what each step returns. Raise the budget by a fixed increment, hold it for two to three weeks, and compare incremental conversions with the step before.
- Read the signals across the last two or three steps. ROAS flattening while spend rises; CAC rising while conversions barely move; incremental revenue per added dollar falling toward breakeven. The executive test: if the next 10% of spend adds less than the previous 10% did, you are past the point.
An illustrative sequence:
- First $10K: 100 leads, a marginal cost per lead of $100
- Next $10K: 40 leads, or $250 each
- Next $10K: 15 leads, or $667 each
The point of diminishing returns is the second step, where the marginal cost per lead first crossed the target (say, $200); the third step is close to saturation.
How to locate it across many campaigns
A spend variation test scales to a portfolio: step one campaign's budget up or down for a few weeks while holding the rest steady, and watch incremental conversions across every campaign, not only the one you moved.
An MMM response curve does the same job for every campaign at once. The model fits a curve to each campaign from its spend and outcome history, controlling for seasonality, competition, and carryover so a rival's launch is not misread as saturation; where the fitted curve flattens is that campaign's point of diminishing returns. In practice the useful form of the question is "what does the next $10K return?", which is what scenario forecasting answers. Prescient's Media Forecaster, for example, takes a budget and a goal and returns a campaign-level plan with projected revenue and ROAS next to the baseline, so the point of diminishing returns shows up as the spend level where the forecast stops climbing.
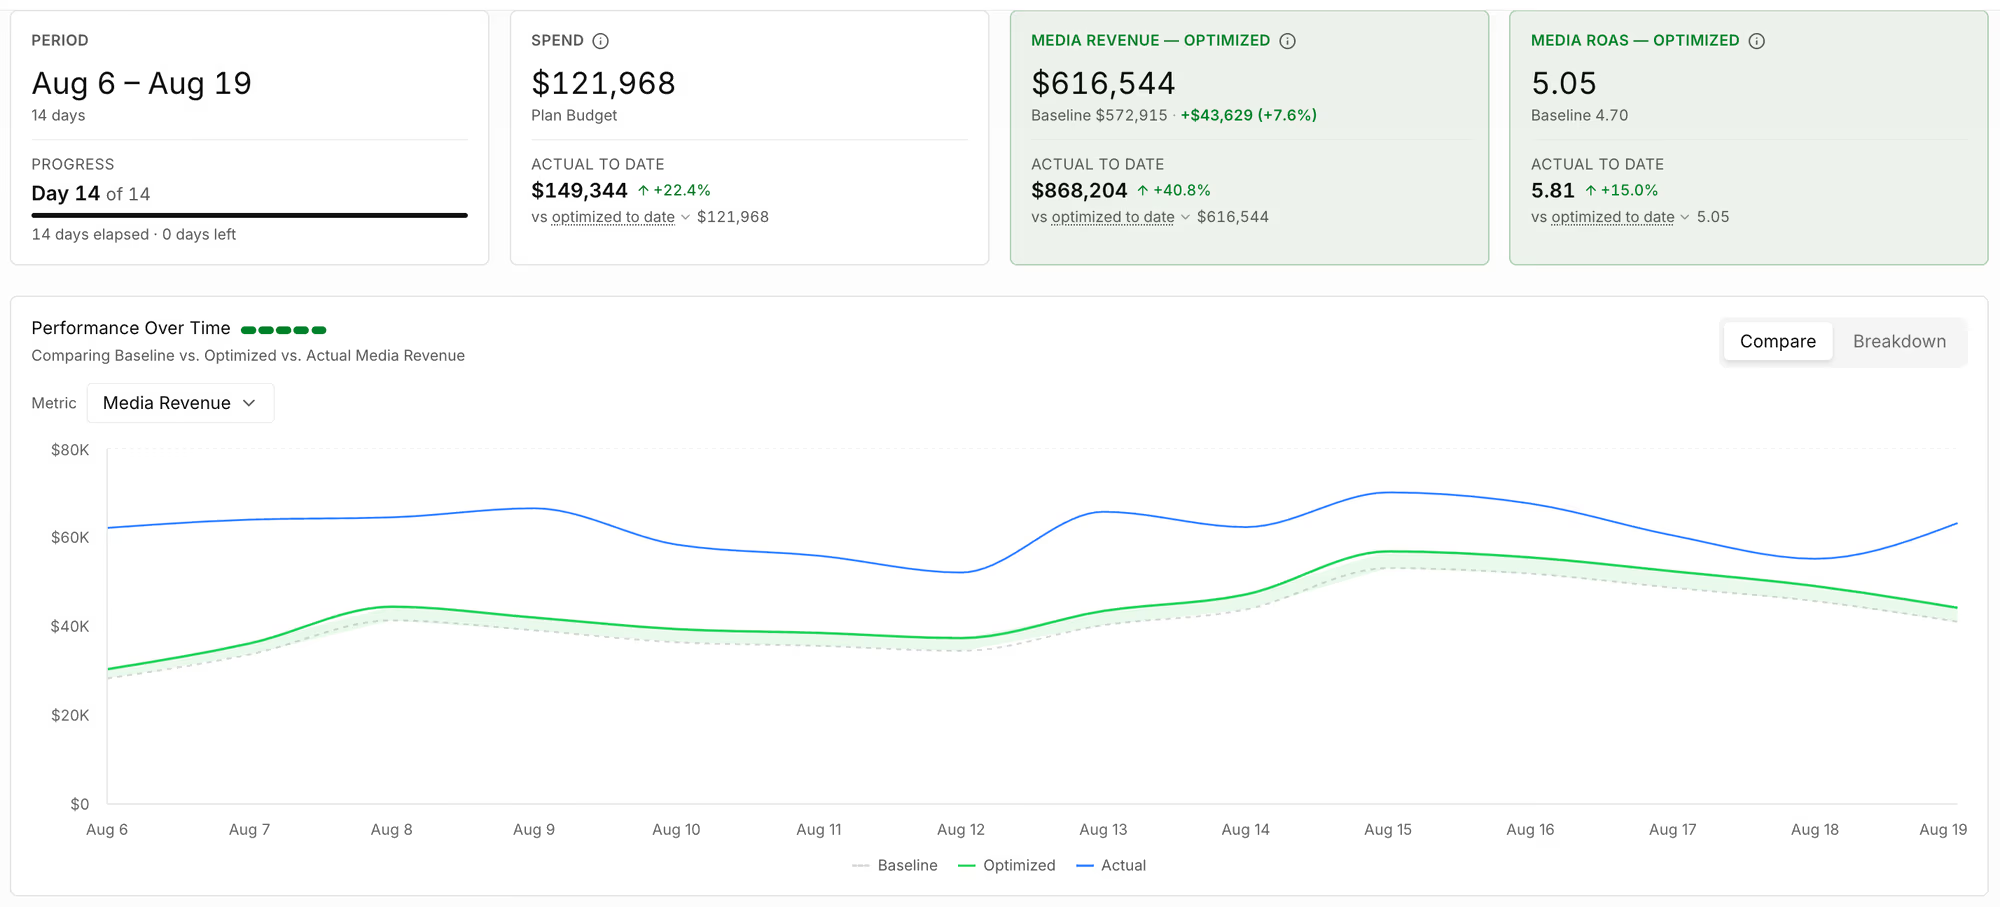
A scenario forecast answers the practical form of the question: at the same spend, the reallocated plan projects 7.6% more revenue than the baseline, and the day-by-day lines show where the actuals landed against it.
A signal is a prompt to check, not a verdict to cut. This table pairs each with what to rule out first.
| Signal of diminishing returns | What to check before cutting spend |
|---|---|
| CPA or CAC rising as spend rises | Whether it feeds retargeting pools or branded search; halo revenue can justify a higher direct CPA |
| ROAS flat across the last two or three budget increases | Creative age and frequency; a refresh resets the curve |
| Incremental revenue per added dollar falling | Seasonality and competitor activity in the same window |
| CTR falling as frequency climbs | Refresh the creative first, then re-read the curve |
| Performance dip right after a budget step | Learning phase and stair-step thresholds; let delivery stabilize before calling it the point |
The oversimplification problem
While the basic concept is valid, most discussions about the point of diminishing returns in marketing oversimplify the reality. Here’s why that’s problematic:
Traditional models typically assume:
A single campaign operating in isolation
(Which also means no top of funnel campaigns bringing in more ideal customers)
A static marketplace with no competitive shifts
Linear consumer behavior with predictable responses
A smooth, continuous curve with one clear peak efficiency point
None of these assumptions hold true in today’s complex marketing landscape. Modern marketing environments are dynamic ecosystems. Multiple campaigns interact across channels, consumer behavior evolves constantly, and external factors regularly disrupt expected patterns.
The factory is where the law fits cleanly, because you control every input and no consumer psychology decides how much product a line can make, and none of those conditions hold for paid media campaigns. We make the longer version of this argument in Law #7: the diminishing returns myth.
The reality of campaign performance
One of the most overlooked aspects of campaign performance is that diminishing returns curves aren’t always smooth with a single efficiency peak after which are diminishing marginal returns. In reality, campaigns can have multiple points of peak efficiency.
Consider these scenarios:
Audience Threshold Effects: A campaign might perform well with a small budget reaching core fans, then experience declining returns as you expand beyond this audience. However, once you reach sufficient scale to target a new valuable segment, performance might improve again before eventually declining.
Creative Fatigue and Revival: Campaigns often see initial strong performance, followed by diminishing returns as audience fatigue sets in. However, refreshing creative or making seasonal adjustments can create a second performance peak, essentially resetting the diminishing returns curve.
Budget Scale Thresholds: Some platforms and campaign types have efficiency thresholds where performance improves once you cross certain spending levels. This creates a “stair-step” pattern rather than a smooth curve, with multiple points of optimized efficiency.
The revival is measurable: a 2013 Marketing Science model of display campaigns that allowed for ad wearout and restoration effects found that rotating creative by each person's impression history raised expected site visits by 12.7% and conversions by 13.8%. Meta documents one such threshold itself: an ad set usually leaves the learning phase, during which CPA is usually higher, only after about 50 results in a week (Meta Business Help Center, 2026), and a 2004 Marketing Science study found that advertising threshold effects exist and response is not always globally concave.
These multiple efficiency peaks mean that what appears to be a point of diminishing returns might actually be a temporary valley before another performance peak. Marketers who understand this complexity can avoid prematurely reducing spend on campaigns that could reach new efficiency peaks with continued investment.
This is not only intuition. When Prescient's data scientists tested the standard saturation assumption on 3,509 daily observations across 20 Facebook campaigns, a straight line fit the data better than either saturating curve on 12 of 16 campaigns by RMSE, and one campaign broke the monotonic assumption altogether: more spend, less revenue. Fitting a separate curve to each campaign, instead of forcing every campaign into one shape, is how Prescient's Marketing Mix Model keeps those valleys and second peaks visible.
The multi-campaign reality
Modern brands rarely run just one campaign. They typically operate:
Multiple campaigns within the same channel
Campaigns across different channels and platforms
A mix of upper and lower funnel marketing tactics
Various creative approaches simultaneously
Each campaign has its own diminishing returns curve, and these curves interact with each other in complex ways. For example:
A seemingly saturated prospecting campaign might still be driving essential new users into your retargeting funnel
A Meta campaign with apparently diminishing returns might be increasing the efficiency of your branded search through halo effects
Two campaigns might appear to be hitting diminishing returns individually, but together they reach audiences that neither could efficiently target alone
This multi-campaign reality means that examining the diminishing returns of any single campaign in isolation provides an incomplete picture. The true measure of efficiency must account for how campaigns work together within your overall marketing ecosystem.
Cross-channel consumer journeys
Today’s consumer rarely experiences a brand through just one marketing channel. They might:
See a YouTube ad that creates awareness
Encounter a display retargeting ad that maintains interest
Click on a paid search ad when ready to purchase
Convert after receiving an email promotion
In this environment, evaluating diminishing marginal returns on a channel-by-channel basis misses the bigger picture of how channels interact to guide the customer journey. A Facebook campaign might appear to hit diminishing returns when measured in isolation, but it could be significantly improving the performance of your Google Ads campaigns by creating awareness and consideration.
Cross-device behavior complicates this further: a consumer might view your ad on mobile, research on a tablet, and buy on a desktop, a journey that single-channel diminishing returns analysis cannot capture (see how to measure cross-channel attribution).
Campaign interactions and halo effects
When multiple marketing campaigns run simultaneously, they create complex interactions that influence overall performance. These interactions include:
Halo Effects: When one campaign creates benefits that spill over to other marketing efforts. For example, a TV campaign might boost the performance of your paid search ads by increasing brand awareness and search volume; a 2014 Management Science study found TV advertising raised both the number of related Google searches and the share of searchers using branded keywords.
Synergistic Effects: When two campaigns work better together than either would alone. For example, a combination of prospecting and retargeting campaigns might create a funnel that’s more efficient than the sum of its parts.
Competitive Effects: When campaigns compete for the same audience or inventory, potentially creating internal competition that reduces overall efficiency.
These interactions mean that the diminishing returns curve for any individual campaign is constantly being reshaped by the performance of other marketing activities. A campaign that appears to be approaching the point of diminishing returns might actually be enabling other campaigns to perform better.
At Prescient AI, our modeling captures these halo effects, measuring how campaigns lift not just direct conversions but also branded search, direct traffic, and sales across retailers, giving a more complete picture of what each channel contributes.
How external factors reshape diminishing returns
Just as a marathon runner’s performance can be influenced by weather, crowd support, or competitors, your marketing campaign’s diminishing returns curve can be dramatically reshaped by external factors:
Competitive Shifts: If your main competitor suddenly pauses their campaign or exits your market, your campaign’s efficiency might unexpectedly improve.
Viral Moments: If your product suddenly becomes popular on TikTok or another social platform, your paid campaigns might experience improved performance as they benefit from increased organic interest and relevance.
Seasonal Changes: Consumer behavior changes throughout the year can cause fluctuations in your campaign’s performance curve, creating temporary efficiency improvements during high-demand periods.
Market Disruptions: Economic shifts, industry news, or regulatory changes can alter how consumers respond to your marketing, potentially improving efficiency where you previously saw diminishing returns.
Algorithm Updates: Platform algorithm changes can suddenly make previously inefficient spend levels perform better (or worse).
These external factors mean that what appears to be a point of diminishing returns today might not be one tomorrow. The dynamic nature of marketing environments requires ongoing evaluation rather than one-time optimization decisions based on static models.
Clarifying diminishing returns vs. saturation
Marketers often use the terms “diminishing returns” and “saturation” interchangeably, but they represent different (though related) concepts:
Diminishing Returns refers to the economic principle where additional investment yields progressively smaller benefits. This is a gradual process—returns don’t disappear, they simply decrease incrementally.
Saturation represents a point where a market or audience has been so thoroughly exposed to your marketing that additional exposure produces negligible results. Saturation is effectively the end stage of diminishing returns.
The key difference: Diminishing returns is the journey, the point of diminishing returns is the inflection point, and saturation is the destination. A campaign experiencing diminishing marginal returns still generates value (just less efficiently), while a truly saturated campaign generates minimal additional value.
It’s also worth noting that full saturation is rare in digital marketing—what often appears to be saturation may simply be a temporary efficiency decline before another peak, or the result of failing to refresh creative or targeting strategies.
Better approaches to understanding marketing efficiency
Given the complexity of diminishing marginal returns in modern marketing, how can marketers make better decisions? Here are some approaches:
Holistic Measurement: Look beyond individual campaign metrics to understand cross-campaign and cross-channel effects. Marketing mix models that fit a separate saturation curve to each campaign, rather than one curve per channel, can capture these interactions. Prescient's Marketing Mix Model does this with neural networks that learn the shape of each campaign's data, and it updates daily, so the curve moves when the campaign does.
Dynamic Optimization: Rather than making one-time decisions based on static diminishing returns curves, continuously evaluate and adjust campaigns based on real-time performance data and changing market conditions.
Longer Measurement Windows: Extend your analysis timeframe to capture delayed impacts and halo effects that might not appear in short-term performance data.
The goal isn’t to ignore these effects and charge past the point of diminishing returns—it’s to understand them in the context of your overall marketing ecosystem rather than in isolation.
Practical applications for marketers
How can you apply these insights to your marketing strategy? Start with these practical approaches; the marketing budget optimization guide covers the reallocation mechanics.
Before reducing spend on a campaign with apparent diminishing marginal productivity: run the checks in the signal table under "How to find the point of diminishing returns in marketing" (halo contribution, remarketing audience, branded search lift, and whether the dip is temporary).
To test for multiple efficiency peaks:
Gradually scale spending beyond the apparent point of diminishing returns for limited test periods
Monitor for performance improvements after pushing through efficiency plateaus
Test different creative approaches before concluding a campaign is truly saturated
To account for external factors:
Regularly reassess campaigns that previously hit diminishing returns to see if market conditions have changed
Develop contingency plans for rapidly scaling spend when competitive or seasonal factors create favorable conditions
FAQ
What is the point of diminishing returns?
The point of diminishing returns is the level of input, or in marketing the level of spend, at which each additional unit returns less than the one before it. In plain terms, it means the moment a campaign's marginal return peaks and starts to fall while total revenue may still be growing.
How do you find the point of diminishing returns?
Compare the marginal return of each budget step with the step before it rather than the campaign's average return. The point is where marginal return stops rising; a controlled spend test or a marketing mix model's response curve locates it for a given campaign.
At what point do diminishing returns begin?
They begin once a campaign has reached its most receptive audience and each further dollar has to buy attention from people less likely to convert. There is no fixed spend level: the point is specific to each campaign and moves with creative, seasonality, and competition.
What is the difference between diminishing returns and saturation?
Diminishing returns is the journey, the point of diminishing returns is the inflection point, and saturation is the destination. A campaign with diminishing returns still adds revenue, just less per dollar; a saturated campaign adds almost nothing per extra dollar.
Does the law of diminishing returns always apply in marketing?
Eventually, yes: no campaign can absorb unlimited spend at a constant return. But campaigns can have several efficiency peaks, because new audience segments, refreshed creative, and platform spend thresholds reset the curve, so the first flattening is not always the point.
Wrapping it up…
The most sophisticated marketers understand that diminishing returns exist but recognize them as one factor in a complex system rather than a simple rule to follow. They look beyond individual campaign metrics to understand how their marketing activities work together as an ecosystem. Adopting this more nuanced view of diminishing marginal returns can help marketers avoid premature optimization decisions, identify hidden opportunities for growth, and ultimately build more resilient and effective marketing strategies.
Where Prescient comes in
Prescient's Marketing Mix Model fits a saturation curve to every campaign you run, updates it daily, and folds the halo revenue a campaign sends to branded search, direct traffic, and retail into that curve, so a valley reads as a valley and a second peak as a second peak. Media Forecaster then turns those curves into a plan: set a budget and a goal and see the projected revenue and ROAS before you move a dollar. If you want to see where your own campaigns sit on their curves, and what the next $10K would return before you spend it, book a walkthrough.
The Halo
Exclusive insights, every week.
Subscribe to The Halo for sharper marketing thinking.
You're subscribed to The Halo!
Quick question (optional): How familiar are you with MMM?
Thanks for sharing! Enjoy The Halo.
Keep reading
View all
Multi-channel marketing challenges: What gets harder with every channel you add
Read article
Lift vs. incrementality: what the difference actually means for your budget
Read article
How to measure the impact of marketing without guessing
Read article
How to make purpose driven marketing campaigns that actually drive revenue
Read article
What is campaign management software (and what can't it do alone)?
Read article
Can your channel attribution actually measure what's driving conversions?
Read article