There’s a lot of hype around AppLovin in eCommerce.
But still, tangible numbers have been hard to come by.
At least until now.
Below is the first part of an ongoing analysis of customers that we at Prescient currently measure on AppLovin, along with the early observations and hypotheses we’ve noticed about the channel.
What we’re seeing so far on AppLovin, along with the implications that we’ll break down further below:
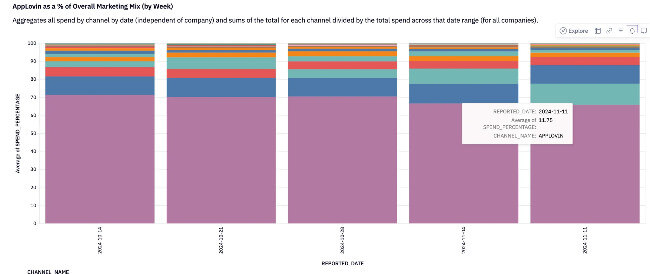
(1) Brands are spending anywhere from 5-25%+ of their weekly total budgets on AppLovin, often pulling ahead of even Google spend while Meta continues to take the lion’s share of budget allocations. Top brands are spending upwards of ~$75k+/day.
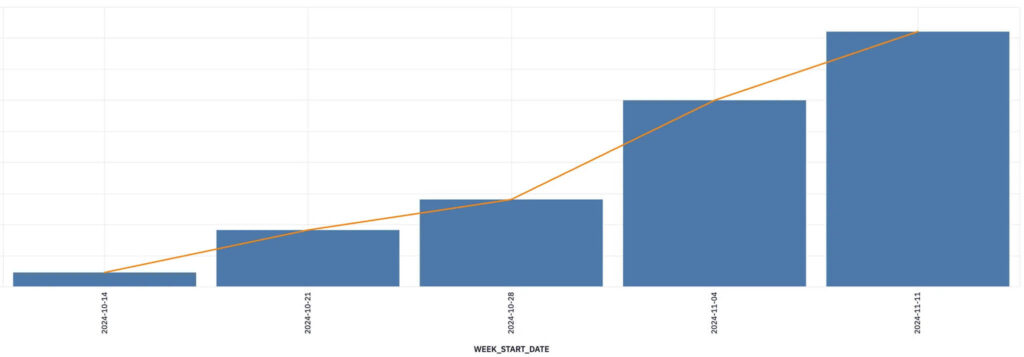
(2) Many top-spending brands are net increasing their overall budgets vs. purely shifting away dollars (and if anything, are shifting away from more bottom-funnel channels like Google and Amazon Ads).
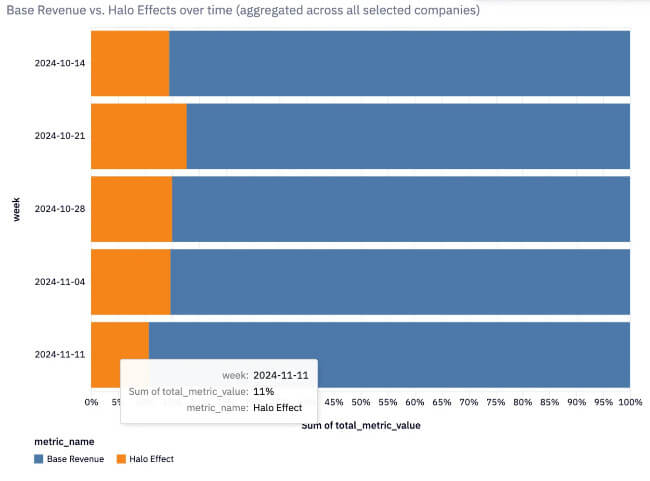
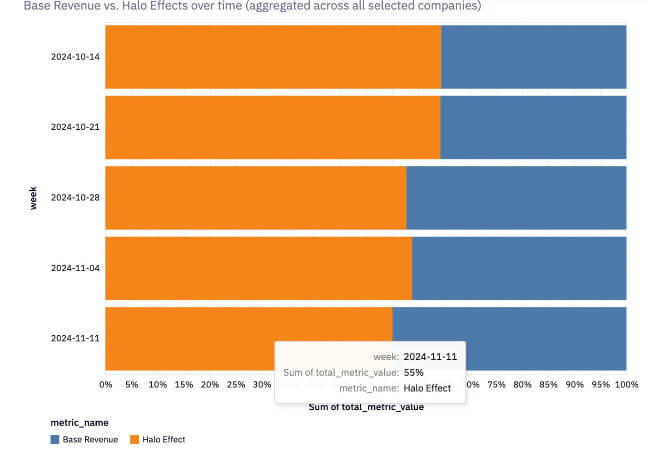
(3) Demonstrating lower “halo effects” on average than channels like Meta, TikTok, and Google (YouTube, PMAX); however, certain brands with omni-channel presences on Amazon and higher AOVs are seeing the opposite be true.
(4) While more efficient MMM ROAS relative to Meta on average (albeit a much lower scale), top-spending brands are more variable especially as they lean into more awareness based Meta marketing leading to higher halo effects.
(1) Spending patterns
While Meta continues to dominate budgets with at least 60%+ of spend, for top-spending brands AppLovin has equaled or overtaken heavyweights like Google (~10%), Amazon Ads (~5%), and TikTok (<3%) for a spot in the marketing mix. However, the bottom 50% of the dataset spends <3% of their mix on AppLovin (more on par with TikTok, with the remaining allocation going to Meta), suggesting there is still a lot of testing and early onboarding still going on.
The fact that some brands have been able to achieve that level of spending scale in a short 2-8 weeks from onboarding is impressive, especially as they are already leapfrogging channels with multibillion-dollar ad businesses like TikTok, Amazon, and even Google.
Since AppLovin’s eCommerce ads network is still in closed beta, it will be interesting to monitor if there’s consistent ability to maintain a level of scale across new and older cohorts as the program opens up.
(2) Net increase in budgets
The fact that many top-spending brands are not shifting but rather scaling overall budgets is a very positive signal that this channel may result in net new incremental customers. This is also despite the fact that this channel is not always the most efficient from an MMM ROAS perspective for larger brands—more on that in point (4). This is truly the holy grail of performance marketing. Relative channel returns should matter less than pure channel unit economics. Marketers theoretically can and should scale indefinitely as long as return targets on ROAS, CAC (or LTV) can be achieved.
For those who are holding budgets more constant, there’s a slight mix shift from channels like Amazon Ads, Google, TikTok, and longer-tail marketing, which may be a signal of pulling away from more demand capture (BOF) channels and testing channels. Also, not to forget, we are in the thick of the holidays, where budgets may be more locked than usual.
(3) Halo effects
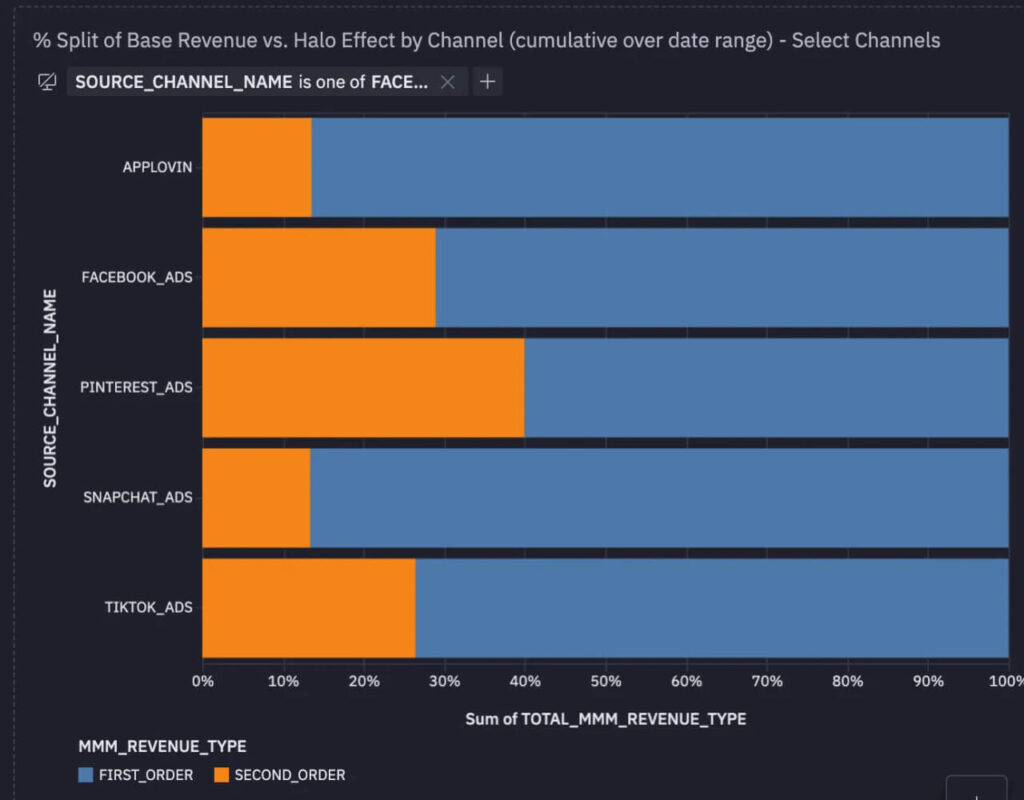
Halo effects, as measured by Prescient’s MMM, measure the delayed impact from seeing an ad to an eventual conversion. On a relative basis, AppLovin demonstrates one of the lowest halo effects as a % of Modeled Revenue (~15% on avg.) vs. core channels like Meta (~30%), Google (~30%, mostly YouTube/PMAX), TikTok (~25%), Pinterest (~40%), and Snap (~13%).
Having low halo effects is not necessarily a bad thing; my hypothesis is that the channel is currently more focused on direct response/mid-funnel strategies to optimize for pixel-trackable conversions. Meta’s and Google’s larger halo effects are also not surprising, given the top-of-funnel approach brands have taken as they exhaust their audiences and become more confident in awareness-based measurement (through tools like MMM and geo-testing/incrementality). Also, halo effects can take time to develop (often up to at least 28 days) and these weekly cohorts may shift as more time and potential conversions come in.
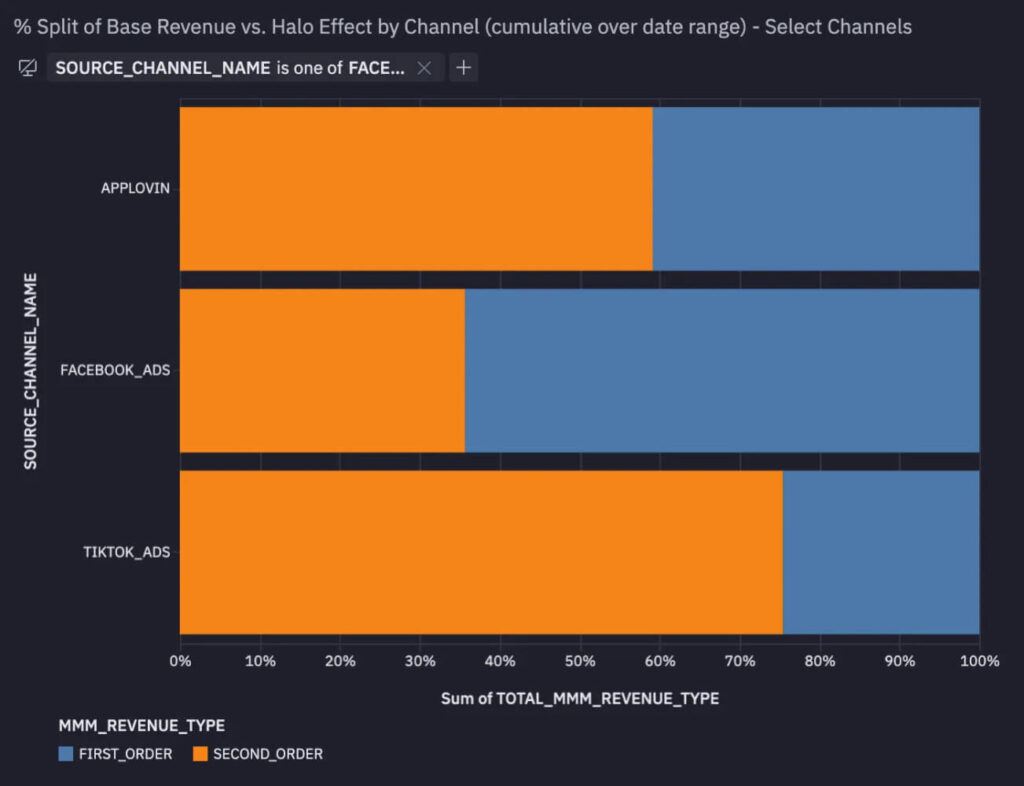
However, this trend of low Halos reverses when looking at brands with Amazon presences (~60%+ of sales vs. DTC on avg.) and higher AOVs (~$100+ on avg.), suggesting that a) targeting on the channel is resonating to lead to interest (and eventual cross-sales channel conversion), b) there’s a potentially short window of awareness to conversion (again leading to a belief that the traffic is high quality).
(4) Efficiency vs. Meta
In measuring normalized channel effectiveness vis-a-vis other channels, we look at the MMM Ratio (e.g., AppLovin’s MMM ROAS / Meta’s MMM ROAS) as well as the MMM RPM (Modeled Revenue per 1000 impressions) to see how effectively spend is converting off served impressions.
On average, AppLovin is more efficient (~1.7x) than Meta, although at 1/5 the spend scale and the median of the set is closer to (~0.9x), which makes real comparisons difficult. Currently AppLovin sits below Meta in MMM RPM avg. (~0.8x) and median (~0.7x).
For top-spending brands we see more variability with Meta MMM ROAS vs. AppLovin with an avg. (~1.4x), median (~0.8x) with 1/3 the spend scale on AL.
A few hypothesis to explain these differences:
- The difference is the halo effects that are prevalent on Meta. Again, this makes sense given the maturity of the platform and the more awareness-based targeting from larger brands. The gap closes when adjusting for halo effects.
- More “spikes” in conversions on AppLovin. The differences in the higher averages vs. lower median results suggest there are more specific days of outsized performance on AppLovin (supporting the more current direct response nature of the channel).
- We still need time. The MMM Ratio has been relatively equal on weekly basis up until a big jump in performance in a recent period which with a more limited dataset of 4 weeks will impact the benchmarks. More time = more consistency to the data and trends. Also as noted above numbers may shift with a lag in attributed halo effects.
I’ve seen people surmise that AppLovin can really take share from Meta, but to me, that’s not the most important question.
To me, the question is whether AppLovin has more of the characteristics of a Meta vs. a TikTok that make it worth the sustained attention of marketers. Given the infancy of the platform, targeting capabilities, less current diversity of ad units to target different parts of the funnel, I’m not surprised by these results and expect they will shift as the channel develops. Yet even when under optimized, AppLovin already appears to be gaining strength over channels like TikTok at higher levels of spend.

What can we take away from this analysis?
AppLovin is showing exciting signals, but it’s still very early, and there’s a lot left to learn. Especially as we’re in the midst of the BFCM holidays and not all brands are likely to drastically shift budgets, many 9 figure brands are still waiting patiently on the sidelines, and we still have limited data to dissect trends by customer type.
What I am most encouraged by is how seriously marketers are taking measurement into account, and we’re just getting started with a host of other methods coming online— from MMM, incrementality, to MTA — that will allow marketers to analyze from different angles and pressure test with more confidence. I am also excited by the possibility that this channel can co-exist alongside scaled channels like Meta and Google to grow budgets vs. purely shifting ad dollars.
Stay tuned for more insights as the channel develops. Below are additional details on the analysis methodology and anonymized dataset.
Notes on methodology and dataset:
- All modeled results are derived from Prescient’s MMM (Marketing Mix Model) from a sample of customers who are active on AppLovin.
- Customers range from beauty, supplements, accessories, apparel, technology, and home goods eCommerce brands that operate on Shopify and Amazon.
- Marketing channels displayed are at least 1% or greater of the marketing mix.
- Brands with Amazon presences have an average of ~60% of sales on Amazon vs. DTC. Brands with higher $AOVs have an average of ~$100.
- (Google) Adwords is inclusive of Youtube, PMAX, Non-Brand and Brand campaigns.
- Halo effects = Second Order revenue derived from specific campaigns, also known as the delayed effect from awareness to conversion. Halo effects help re-distribute credit from the bottom to top of funnel marketing channels and campaigns.
- Base revenue = First Order revenue derived from specific campaigns, most akin to last-click but probabilistically measured.
- MMM ROAS = Marketing Mix Model calculated Return on Ad Spend as measured by Prescient.
- MMM RPM = Modeled Revenue per 1000 impressions as measured by Prescient. Modeled Revenue includes base (first order) and halo effect (second order) revenue.

Will Holtz has spent over a decade working at the intersection of data, eCommerce, and marketing. As VP of Strategy & Operations at Prescient AI, he leads analytics efforts and has authored widely-referenced benchmark reports. These reports are used by brands, investors, and operators to understand how marketing dollars drive growth across channels. Will earned his MBA from The Wharton School, where he focused on Marketing Analytics, after starting his career in finance at Morgan Stanley and Soros Fund Management. He’s passionate about turning complex data into insights that help brands and investors make better decisions.

