


YouTube MMM benchmarks
There is also evidence that top-quartile brands have been figuring out YouTube channel while driving greater efficiency and incremental growth.
Will Holtz · 6 min read

While YouTube offers immense scale, it has long been a challenging channel for ecommerce marketers.
Less-interactive ad formats, less predictable performance, and the lack of reliable measurement signals has held the channel back from its potential.
While the data below partially supports this narrative, there is also evidence that top-quartile brands have been figuring out this channel while driving greater efficiency and incremental growth.
Key findings discussed in this report:
(1) For the average brand spending on YouTube, the channel is past ‘experimental.’
YouTube represents a healthy ~3% of the overall marketing mix and is equivalent to or behind TV (Linear + Streaming), TikTok, and, more recently, AppLovin. However, brands that invest heavily in YouTube allocate ~6% of their budgets consistently to the channel.
(2) YouTube has the highest recorded Halo Effects (%) compared to other core spend channels.
Given YouTube’s a heavy awareness channel with more limited direct response ad forms, this is expected, but it also means that much of the value remains unobserved if not measured properly. This could also explain why Google recently released Meridian, its refurbished open-source MMM, to help marketers better quantify YouTube’s impact.
(3) For the average brand, YouTube generally performs in line with or below other channels from an MMM ROAS perspective.
However, this trend is less pronounced for the top quartile of spenders (and the very top spenders show even more strength). YouTube also has one of the lowest efficiency per impression served, which suggests that operational execution is critical to current success on the channel.
It’s important to highlight that this report focused on the paid performance marketing component of YouTube. Similar to view and social heavy channels like TikTok, there will unobserved value from more of the organic impressions from this channel.
(1) For the average brand spending on YouTube, the channel is past ‘experimental.’
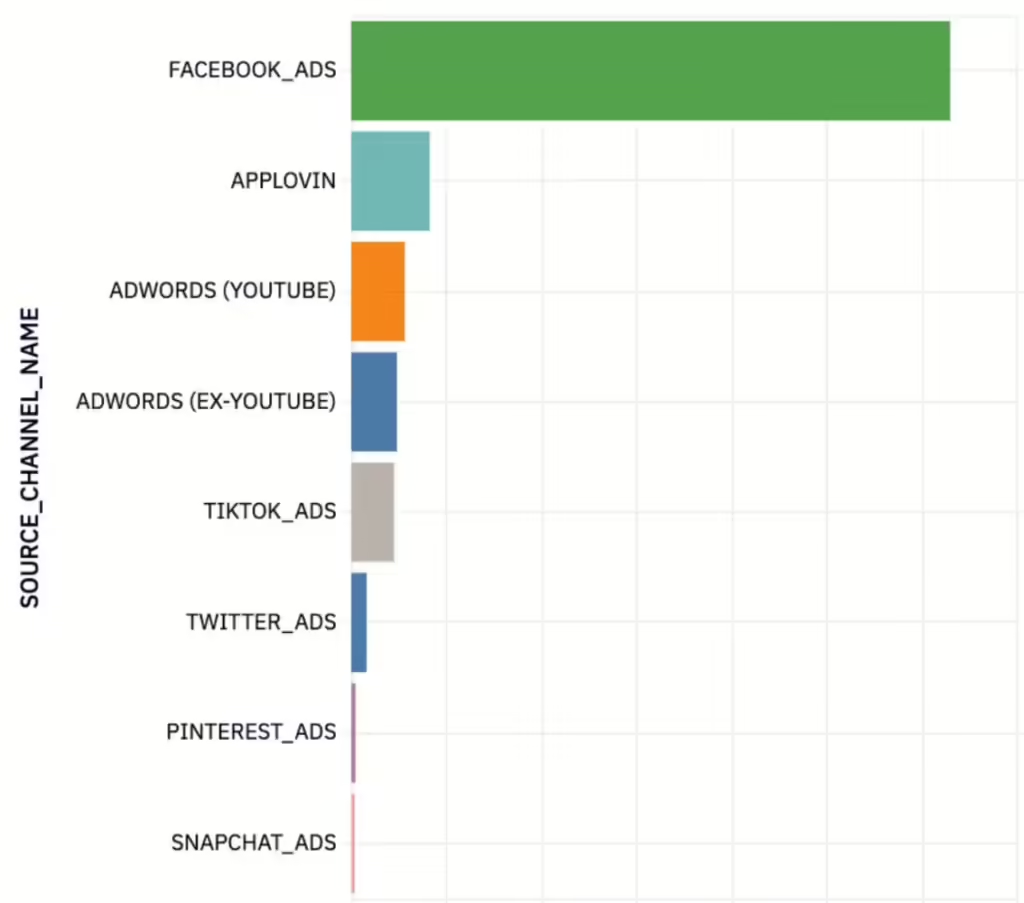
On average, YouTube makes the top five channels in the long-term marketing mix (LTM) period, ranking behind Meta, Adwords (excluding YouTube), Amazon Ads, and the consolidated group of TV-based vendors (Linear + Streaming) but ahead of TikTok (~2.1%). Over the past three months, YouTube has remained stable at ~3% but has dropped to #6, trailing new entrant AppLovin (~5%).
Many campaigns on YouTube are short-lived—~9.4% include the words “test” or “testing” in their naming, and only ~10.5% remain active a year after launching—implying that many marketers have yet to form a consistent program.
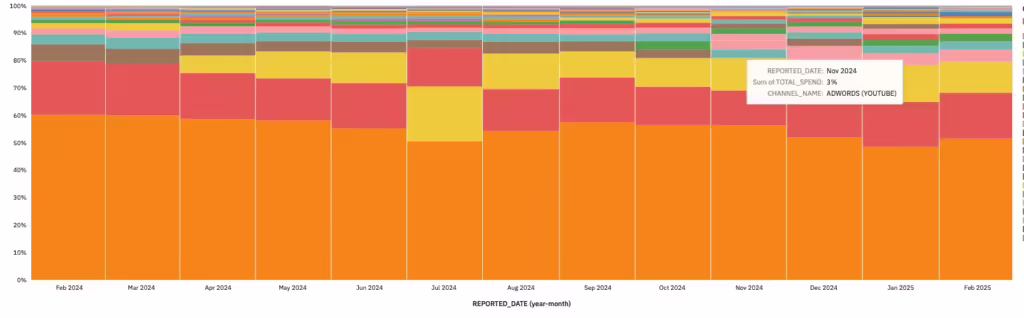
LTM marketing mix across all brands in analyzed cohort – Adwords (YouTube) represents ~3% in this period
For the top quartile of brands spending on YouTube, the channel’s share doubles to ~6%, ranking #3 behind Meta and Adwords (excluding YouTube) and ahead of TV, Amazon, and TikTok. Over the last three months, YouTube’s share has remained in the 5.5-6% range, while Meta and Adwords (excluding YouTube) have shifted more toward AppLovin (~4.8%) and TikTok (~3.1%).
While it’s too early to draw firm conclusions, the consistent investment in YouTube and the movement toward top-of-funnel channels with strong halo effects—such as AppLovin and TikTok—suggest that marketers are becoming more comfortable measuring incremental ROI on these historically difficult to prove channels (more on this below).
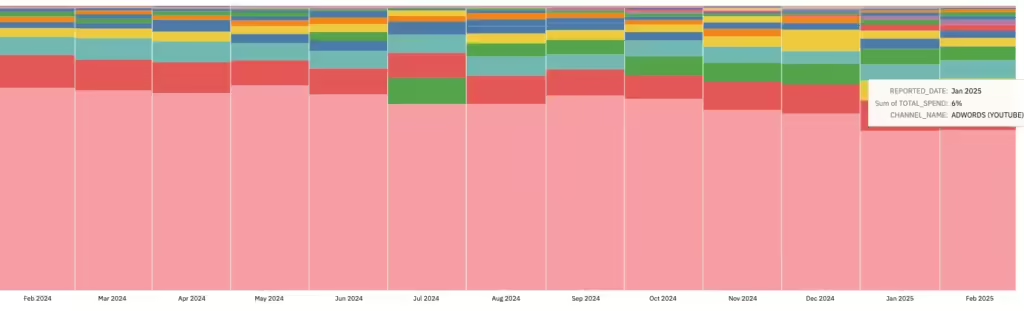
LTM marketing mix across all top quartile of spenders on YT in analyzed cohort – Adwords (YouTube) represents ~6% in this period
(2) YouTube has the highest recorded halo effects (%) compared to other core spend channels.
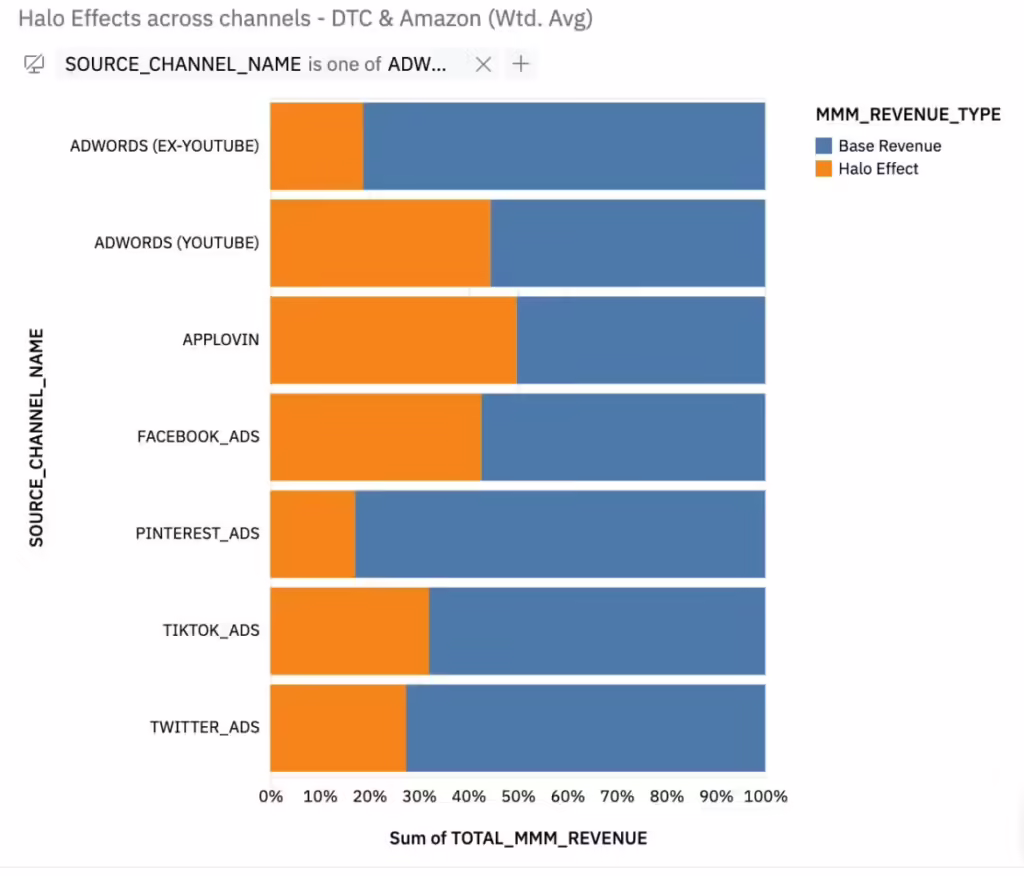
Halo effects, as measured by Prescient’s Marketing Mix Model, capture the delayed impact of an ad on eventual conversions. Relative to other platforms, YouTube demonstrates the highest halo effect as a percentage of modeled revenue (~46% on average), compared to:
Meta (~39%)
AppLovin (~39%)
TikTok (~38%)
Adwords (excluding YouTube) (~23%)
Pinterest (~23%)
This is not surprising as YouTube is heavily view-based and difficult to measure with traditional tools, given the dataset’s CTR of
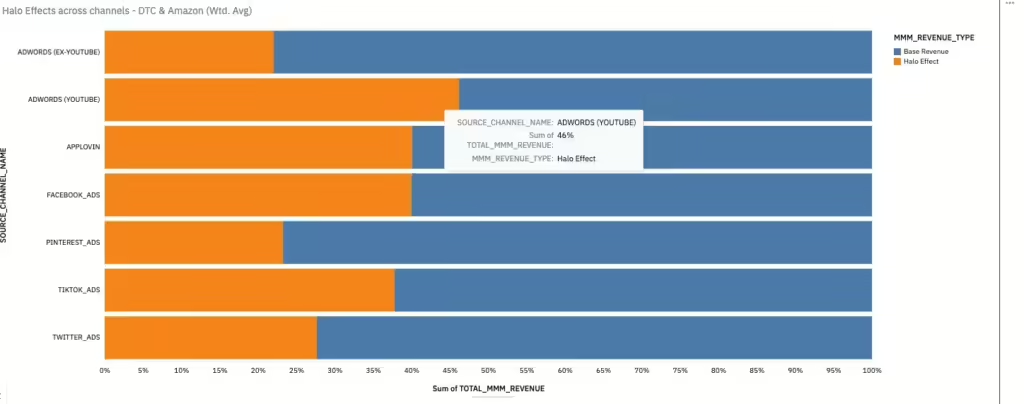
Halo effects % across all brands in analyzed cohort
For the top-spending quartile, YouTube’s halo effect percentage is consistent (~44%), ranking just above Meta but behind AppLovin (~50%).
Omnichannel brands in this cohort derive more value from Amazon (~12% of halo effects vs. 7% for the average brand). Interestingly, despite having a more limited history and lower overall spend, AppLovin is already driving more absolute halo effect revenue to Amazon.
Halo effects % across all top quartile of spenders on YouTube in analyzed cohort
MMM Revenue ($) to Amazon across all top quartile of spenders on YouTube in analyzed cohort
(3) For the average brand, YouTube generally performs in line with or below other channels from an MMM ROAS perspective.
In measuring normalized channel effectiveness vis-a-vis other channels, we look at the MMM Ratio (e.g., YouTube’s MMM ROAS / Facebook’s MMM ROAS) as well as the MMM RPM (Modeled Revenue per 1000 impressions) to see how effectively spend is converting off served impressions.
YouTube generally performs in line with or below comparable channels. Given that other platforms are better at capturing “direct” (base) revenue and operate with higher efficiency at lower scale, this is not surprising.
However, the gap would be even wider without halo effects. According to Prescient’s measurement, YouTube’s MMM ROAS is ~2.0x higher than its channel-reported metrics when halo effects are accounted for.
YouTube has excellent reach (impressions) with ~12% of the total in the LTM period (while serving as ~3% of spend)—yet the efficiency (MMM RPM – CPM) on those impressions is also the lower end of the reported channels. If anything this is the most promising signal of opportunity in the channel—if targeting and operational execution (ad formats, creatives) improve there is a lot of impressions to unlock.
The same trend holds for top-quartile spenders, reinforcing the idea that increasing scale does not necessarily lead to diminishing returns.
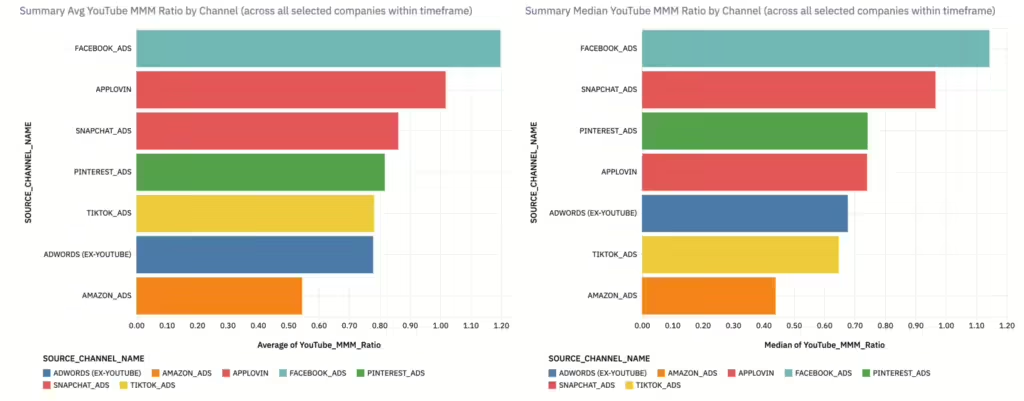
For all brands in this analyzed cohort. MMM Ratio
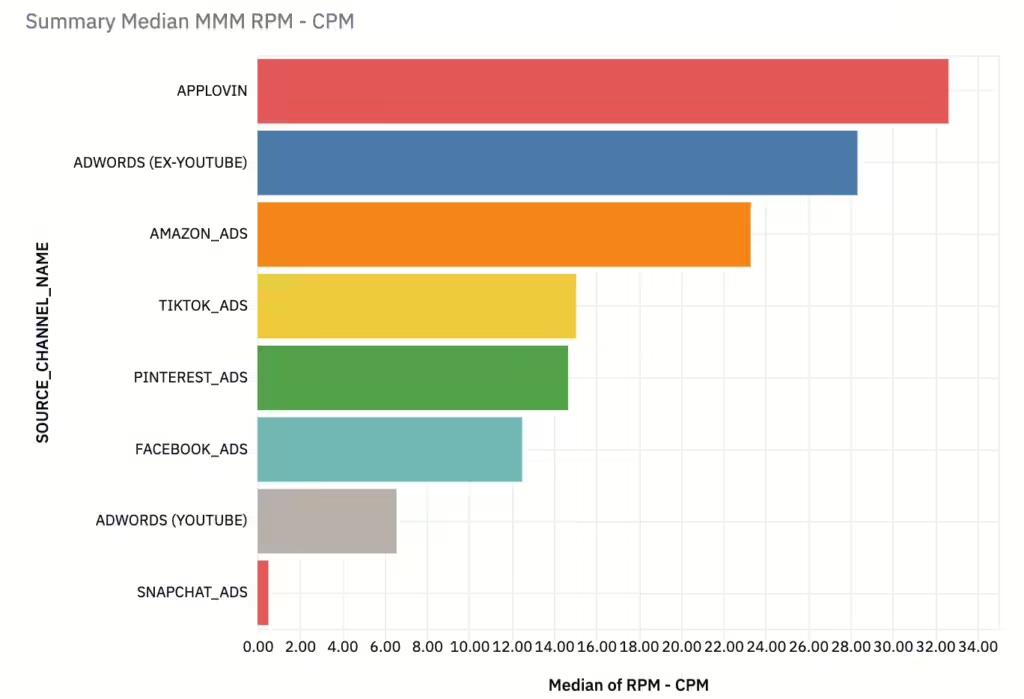
For all brands in this analyzed cohort. MMM RPM = $ Modeled Revenue per 1000 impressions, CPM = $ Spend per 1000 impressions impressions
What can we take away from this analysis?
There are growing signals that YouTube will become a more significant investment channel.
As referenced in the latest “big bets for 2025” letter from YouTube’s CEO, the platform is said to be the #1 player in streaming watch time in the U.S. for the last two years and has over 1B hours of content viewed daily. YouTube also generated $10.47 billion in advertising revenue in Q4 2024, up 14% year-over-year, with total advertising revenue reaching $36.1 billion over the past two years (according to Eric Seufert).
Yet most ecommerce brands haven’t fully committed just yet.
Unlike new entrant AppLovin that has already taken an equivalent spend share, YouTube does not currently have familiar direct response ad units and targeting capabilities like Meta. YouTube—much like its TV and TikTok counterparts—requires a dedicated operational playbook to scale effectively.
Additionally, many marketers still view YouTube as a partially experimental channel, given its lower predictability and the continued reliance on click-based measurement models that may not fully capture its impact. As Google shifts focus away from search revenue, it’s no surprise that they recently released an updated version of their open-source MMM, Meridian, recognizing that the only way for marketers to truly realize YouTube’s value is by measuring its halo effects as they build more features that cater to direct response marketing.
Personally, I am bullish on YouTube as ad units become more standardized, targeting improves, and the industry increasingly adopts more accessible methods for measuring top of funnel channel effectiveness.
Notes on methodology and dataset:
All modeled results are derived from Prescient’s MMM (Marketing Mix Model) from a sample of customers who have actively run at least one campaign on YouTube (1600+ campaigns) in the data range of the analysis (February 19, 2024–February 19, 2025).
Customers range from beauty, supplements, accessories, apparel, technology, and home goods ecommerce brands that operate on DTC and Amazon.
Marketing channels displayed are at least 0.5% or greater of the marketing mix.
Halo effects = second order revenue derived from specific campaigns, also known as the delayed effect from awareness to conversion. Halo effects help re-distribute credit from the bottom to top of funnel marketing channels and campaigns.
Base revenue = first order revenue derived from specific campaigns, most akin to last-click but probabilistically measured.
MMM ROAS = Marketing Mix Model calculated Return on Ad Spend as measured by Prescient.
MMM RPM = Modeled Revenue per 1000 impressions as measured by Prescient. Modeled Revenue includes base (first order) and halo effect (second order) revenue.
The Halo
Exclusive insights, every week.
Subscribe to The Halo for sharper marketing thinking.
You're subscribed to The Halo!
Quick question (optional): How familiar are you with MMM?
Thanks for sharing! Enjoy The Halo.
Keep reading
View all
If your MMM provider started in MTA, here's what might be happening with your data
Read article
The problems with vibe-coded MMMs and what they cost you
Read article
Prescient's branded search attribution FAQs and answers
Read article
Most incrementality tests are not rigorous randomized controlled trials—here’s why
Read article
AppLovin MMM benchmarks – part II
Read article
AppLovin MMM benchmarks – part I
Read article