


- Industry Watch: Stores will still take most of this year's holiday sales.
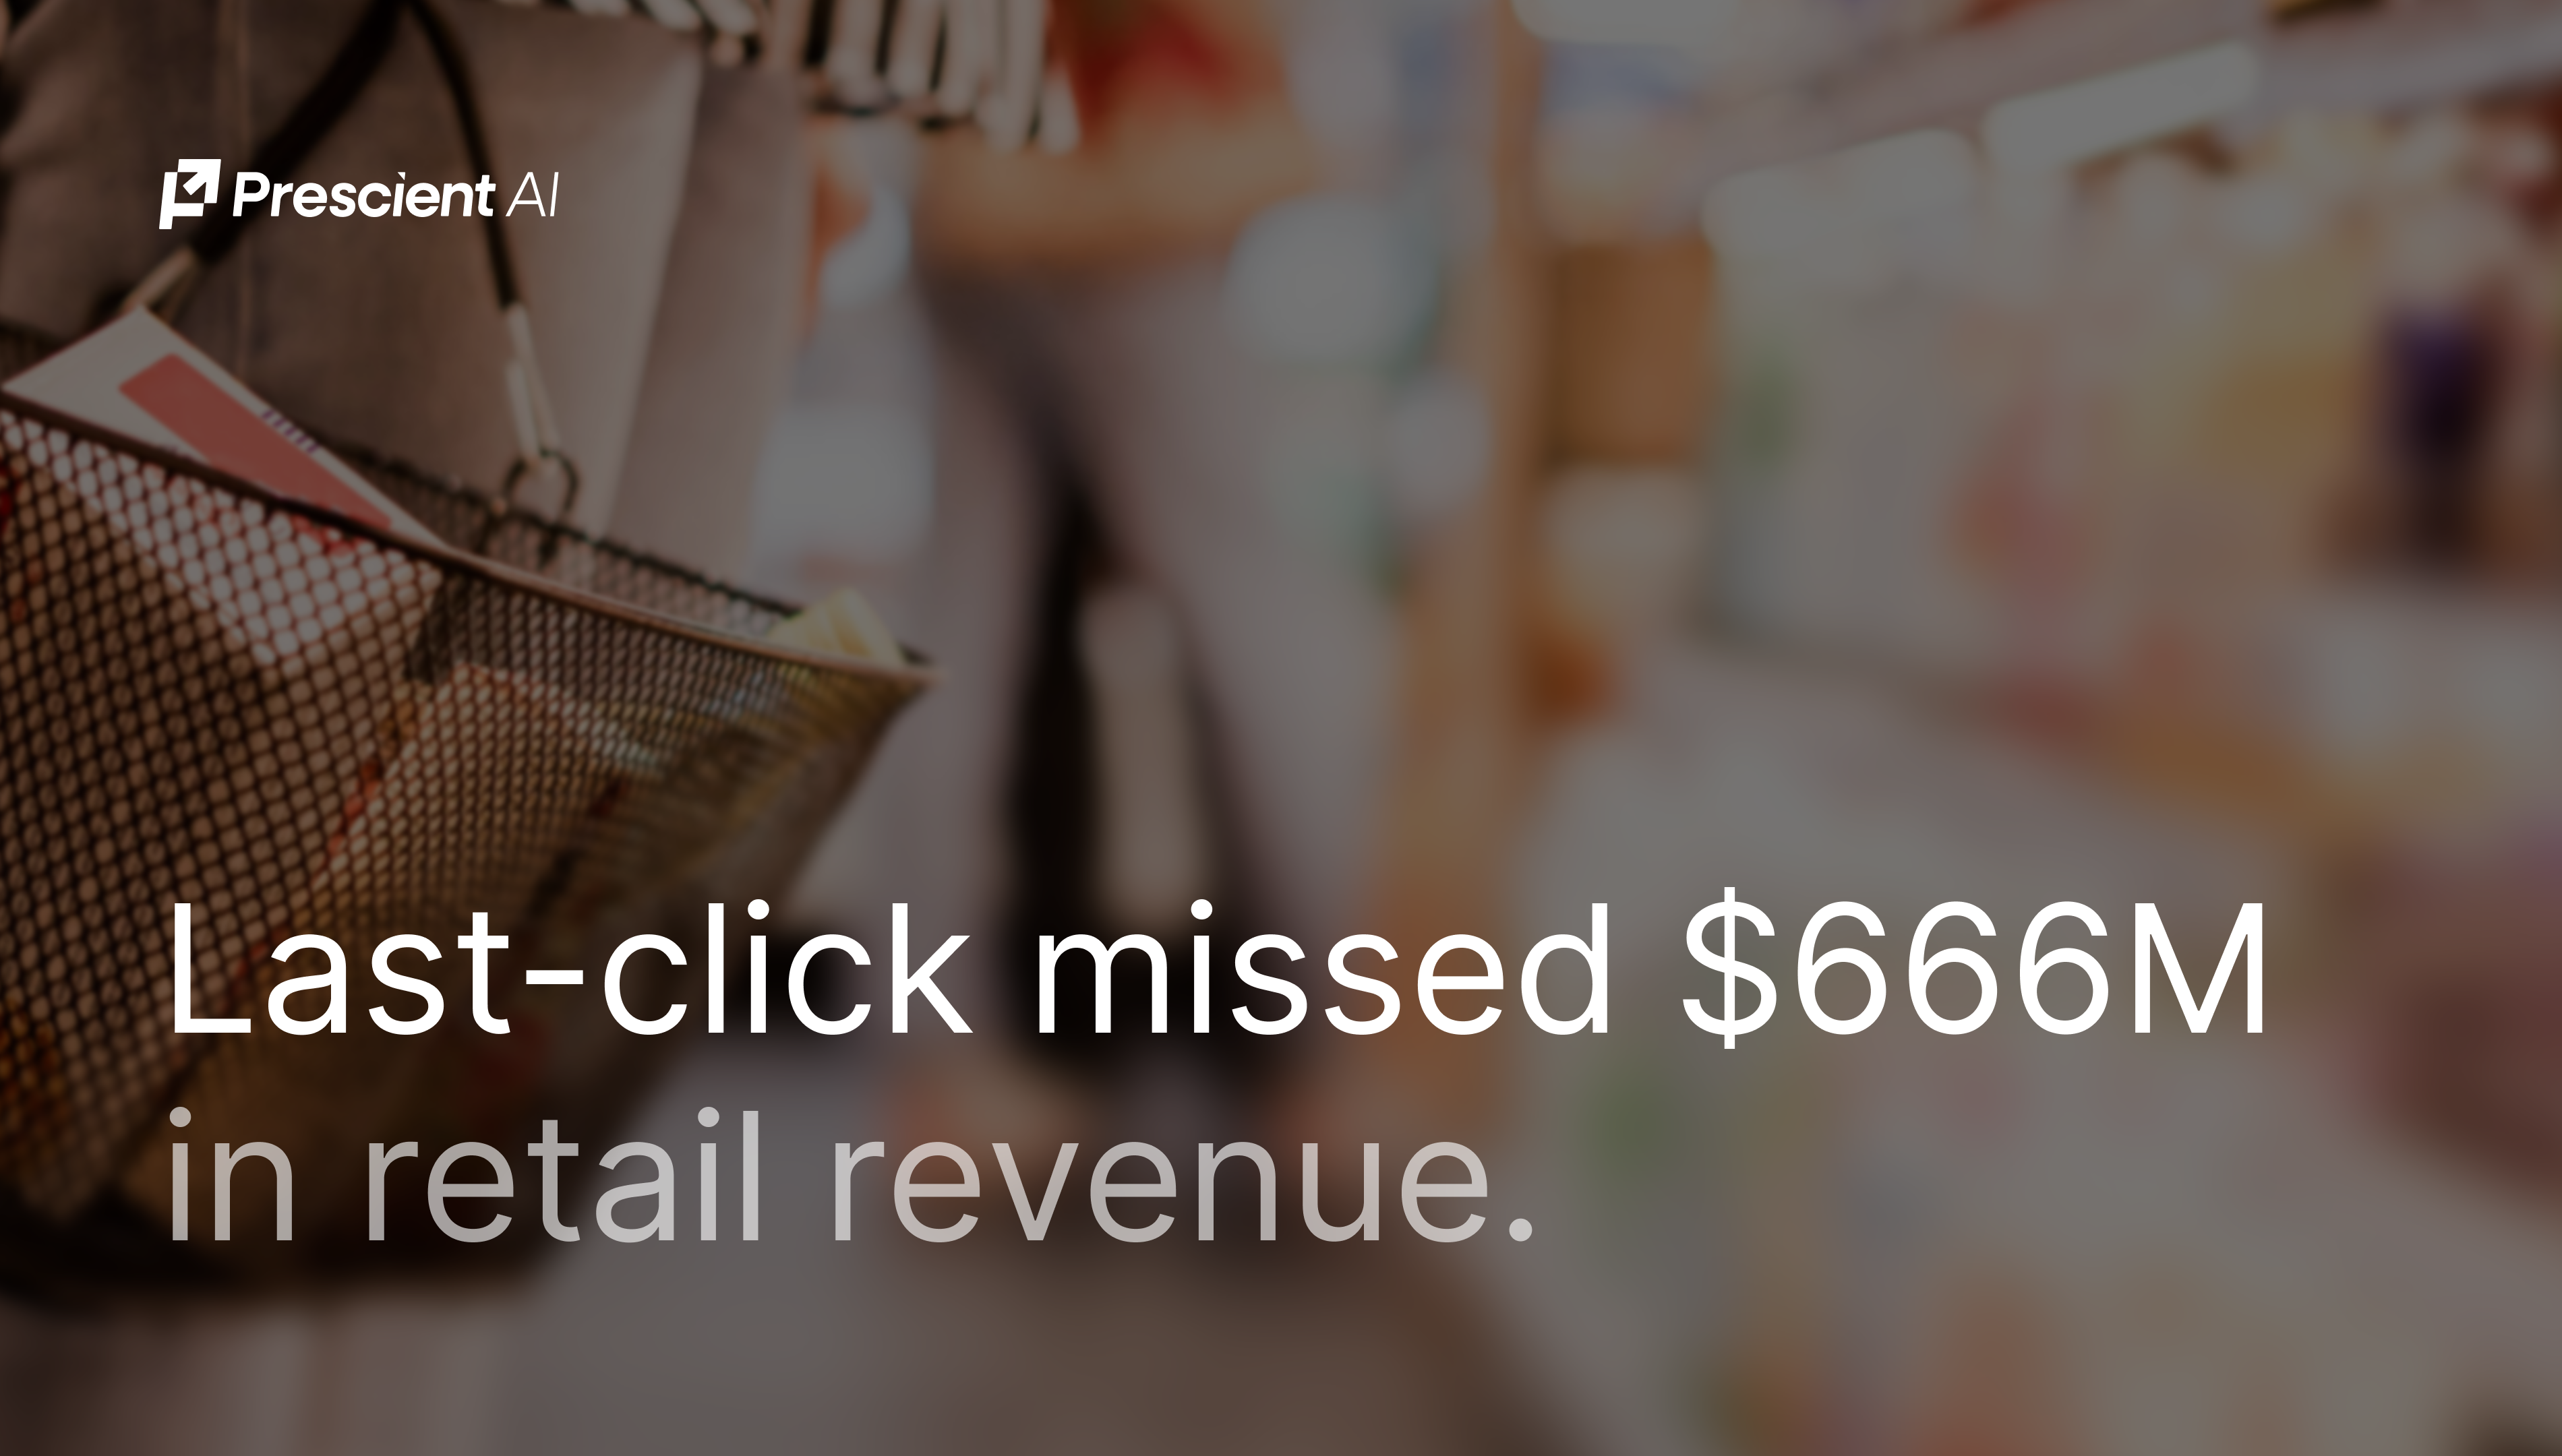
- The Benchmark: We break down the $666M in retail revenue that last-click couldn't see by channel and category.
- From the Blog: Can MMM measure marketing when customers buy through multiple channels?
- Four Moves: What you should take away from our new benchmark report before you work on your next media plan.
- Three Things: Three reads on direct mail, marketing control, and confidence intervals.
Our new retail benchmark covers $541M in tracked ad spend from July 2025 to June 2026. That spend drove $666M in revenue that closed in stores or on retailer websites ($1.23 for every dollar spent), and last-click attribution never picked up any of it.
This week we're publishing the full benchmark: where that revenue lands, which channels are behind it, and how the picture changes by category.
Welcome to The Halo. Each week: one piece of measurement analysis, the best of the blog, one insight based on real customer spending, and three reads worth your time. This week, the new benchmark takes the customer slot.
Let's dive in.
INDUSTRY WATCH
Stores will still take most of this year's holiday sales
Deloitte forecasts US holiday retail sales of $1.70 trillion to $1.71 trillion between November 2026 and January 2027, up 4.0% to 4.8% year over year. E-commerce is growing faster, projected to drive between $316.1 billion and $318.9 billion of that spending, up somewhere between 7.5% and 8.4% year over year. Despite the speed of its growth, it's still one of the smaller destinations for holiday shopping.
Most holiday spending is expected to happen in physical stores, where a brand's own site tracking can't follow the sale.
This week's benchmark measures how much of that store and retailer revenue comes from paid media, and from which channels.
Source: Deloitte holiday retail forecast (Sep 10, 2026).
01 · THE BENCHMARK
Paid media drives retail sales it never gets credit for

For the typical brand in our benchmark study, 29% of the revenue its ads drive lands in retail, in physical stores, or on retailer websites, and another 25% lands on Amazon. Only about a third closes on the brand's own site, the one place a pixel can track. Summed across every brand, the retail share comes to $666M, 36% of all ad-driven revenue.
The channels getting the biggest paid media budgets are the ones driving fewer retail sales. Meta and Amazon Ads take the largest share of spend, but for the typical brand they return $0.73 and $0.68 in retail revenue per dollar spent. Smaller-budget channels like CTV, Pinterest, and YouTube return roughly twice that, as high as $1.69.
Within retail, physical stores earned about 2.35 times what retailer websites did for brands that sell through both, mostly in beauty, roughly $173M against $74M. Category matters too: 46% of beauty's ad-driven revenue reaches retail for the typical brand, against 17% for supplements.
The channels driving your retail sales may be the ones your click-based dashboard says are inefficient.
Methodology: Prescient's weekly-updating marketing mix model, run the same way on every brand, July 2025 to June 2026, $541M in tracked ad spend and $1.84B in modeled revenue. Typical-brand figures carry a 95% confidence range. The client base skews toward larger, established retail brands, so newer or smaller brands could see different results. Brands that didn't report results for a period are left out of that period.
02 · FROM THE BLOG
Can MMM measure marketing when customers buy through multiple channels?
Pixels, last-click, and multi-touch attribution mostly see what happens on a brand's own website, so they miss purchases made on Amazon or in stores. That's the gap we also measured in this week's benchmark.
This post explains how a marketing mix model reads demand across every place you sell, working from spend and sales data without tracking individual shoppers, and how Prescient measures retail halo effects broken out by retailer.
It also covers why traditional MMMs struggle here: modeling each sales channel separately splits marketing's impact apart as if channels don't impact one another, and lumping all revenue together hides where it landed.
03 · WHAT TO DO WITH IT
Four moves before your next media plan
1. Rank your channels by retail contribution. Platform-reported ROAS only shows what closes on your own site. Sort your channels by the share and the dollar amount of retail revenue each one drives, and plan your budget from that order.
2. Fund television where your category supports it. In apparel, Linear TV returned $3.60 in retail revenue per dollar on just $16M in spend, and 98% of its revenue landed in retail. If your category shows a strong TV retail return, treat TV as a performance channel.
3. Give TikTok Web Ads a retail-growth test budget. TikTok Web Ads drive the largest share of retail revenue of any scaled social channel. Judge the test on retail halo effects, since that's where this channel's return shows up.
4. Plan your mix around your target retailer. The channels behind Sephora sales differ from the ones behind Walmart sales. At Sephora, Snapchat returned $2.80 for every dollar spent, well ahead of the channels carrying most of the budget.
04 · THREE THINGS WORTH READING
1. How to use direct mail marketing effectively
In this week's benchmark, we detail how direct mail sends 75% of its revenue into retail for the typical brand, the highest share of any channel. The post covers how to give a direct mail campaign one job, plan a sequence of drops alongside digital, and measure beyond the QR code, since many people respond later through search, Amazon, or a store. Read →
2. You need measurement that can see everything for good marketing control
Marketing control means measuring performance against your goals and correcting course when results drift. The post walks through the four types and the five-step process, and why platform-reported metrics that miss retail sales weaken every step after measurement. Read →
3. What marketers need to know about confidence intervals and statistical significance
The benchmark reports typical-brand figures with a 95% confidence range. This post explains what that range tells you, why a significant result can still be too small to act on, and what a narrow interval can still miss. Read →
The Halo
Exclusive insights, every week.
Subscribe to The Halo for sharper marketing thinking.