




What is a causal graph, and why does it matter for MMM?
What is a causal graph, and why does it matter for MMM? It maps which channels drive which, so credit follows how marketing really works. See how.
Linnea Zielinski · 12 min read
An electrician walking into a 100-year-old house wants the wiring diagram before touching anything. Without it, she could flip breakers and watch what goes dark, but that only shows what happens together. If a storm knocks out the kitchen lights and the TV at the same moment, the TV didn't cut the lights. Both share a circuit upstream, and only the diagram shows it.
A causal graph is that diagram for your marketing. So, what is a causal graph, and why does it matter for a marketing mix model (MMM)? A causal graph is a map of which factors drive which, drawn as arrows that point from cause to effect. In an MMM, it tells the model things like "holiday demand raises both ad spend and sales," "video creates interest that branded search later converts," and "a Meta ad can lead to a purchase on Amazon." Without that map, a model can match your revenue perfectly and still hand credit to the wrong channels. With it, the model has a much better chance of separating what your ads did from what would have happened anyway, though the graph is only as good as the assumptions behind it.
That matters because the arrows in a model decide where your budget goes. If a model assumes branded search creates demand on its own, it'll keep recommending more branded search while the campaigns that actually built that demand get cut.
Key takeaways
- A causal graph, also called a directed acyclic graph (DAG), maps which factors drive which, using nodes for the factors and arrows for the direction of influence.
- In marketing mix modeling, a causal graph spells out assumptions such as seasonality driving both spend and sales, and video creating demand that branded search captures.
- Causal graphs help a model avoid three common traps: missing a factor that drives both spend and sales, subtracting away part of a channel's own effect, and creating false links by filtering the data the wrong way.
- Many traditional and open-source MMMs add up channels as independent slices, so they have no structure telling them which channel feeds which.
- Prescient's model uses a causal graph as one of its core structures, along with modeling demand that builds over time, so credit follows how marketing actually works.
- A causal graph can't prove its own assumptions, create information the data doesn't contain, or measure how big an effect is on its own.
- When evaluating an MMM, ask how its causal structure was chosen, what it assumes about demand creation and capture, and what checks it runs besides matching history.
Why measuring marketing needs cause and effect, not just correlation
Spend and revenue often rise together for reasons that have nothing to do with how well your ads work. That's the core problem every MMM has to solve.
Take a skincare brand gearing up for Mother's Day. It raises Meta and YouTube budgets three weeks out, and revenue climbs 40%. But that same month, gift shoppers are searching for skincare, retail partners are running promotions, and the brand's own email list is getting extra sends. Spend went up because the team expected demand, so the two moving together doesn't say how much revenue the ads created.
A model that only looks for patterns will find a strong one and may give the ads credit for gift-season demand. A model that knows Mother's Day drives both the spend and the sales can try to separate the two. Encoding that knowledge is exactly what a causal graph is for.
What is a causal graph?
A causal graph is a diagram of assumed cause-and-effect relationships. In statistics, the most common version is a directed acyclic graph, or DAG. The name breaks down simply.
- Nodes are the factors in the system, such as Meta spend, branded search volume, seasonality, or Amazon revenue.
- Arrows show which factor influences which. An arrow from YouTube spend to branded search means "YouTube spend affects branded search," not the other way around.
- Directed means every arrow points one way.
- Acyclic means you can't follow the arrows in a loop and end up where you started.
A simple marketing example shows how this reads in practice. The table lists each arrow in a small, illustrative graph.
| From | To | What the arrow says |
|---|---|---|
| Seasonality | Ad spend | Brands spend more when they expect demand |
| Seasonality | Sales | Shoppers buy more at certain times of year |
| YouTube spend | Brand awareness | Video introduces people to the brand |
| Brand awareness | Branded search | People who know the brand search for it |
| Branded search | Website sales | Searches convert on the site |
| Brand awareness | Amazon sales | Some aware shoppers buy on Amazon instead |
| Meta spend | Website sales | Some Meta ads drive purchases directly |
Drawn as a picture, the same graph looks like this:
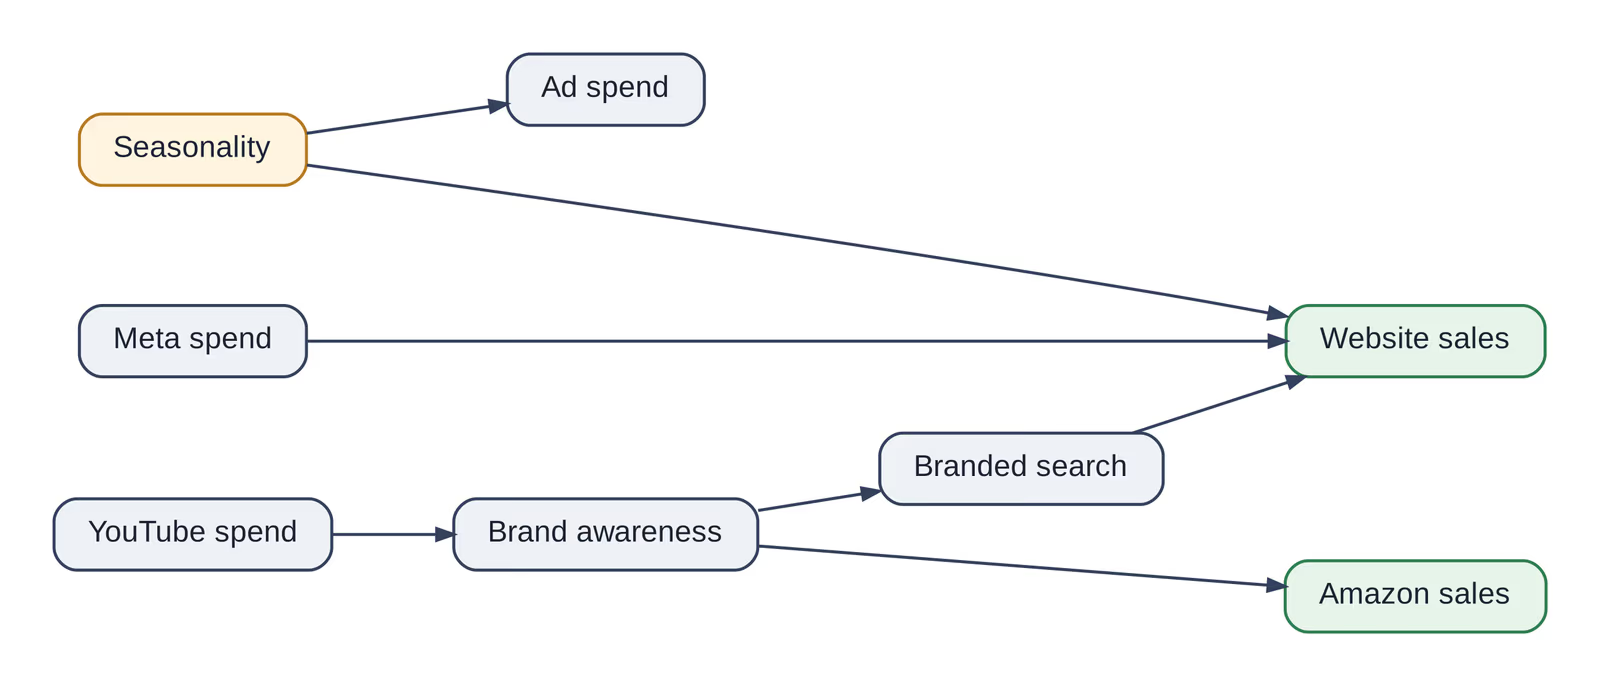
Even this small graph says a lot. Seasonality drives both spend and sales, so it has to be accounted for. YouTube's effect travels through awareness and branded search, so search shouldn't get all the credit. And some of YouTube's value shows up on Amazon, where a website-only view would never see it.
What about feedback over time?
Marketing does loop in real life. Strong sales lead teams to raise budgets, which lead to more sales. A DAG can't contain a loop, but it handles this by splitting time into steps: this week's sales can affect next week's spend, which affects the following week's sales. Laid out over time, the arrows never circle back on themselves.
That matters for measurement. A model that ignores how past results drive future budgets may mistake "we spent more because sales were strong" for "sales were strong because we spent more."
Three relationships a causal graph helps you spot
The biggest practical value of a causal graph is knowing what a model should and shouldn't account for. Adding more variables doesn't automatically make an MMM more accurate. Some additions make it worse.
| Relationship | What it is | Marketing example | What goes wrong if it's mishandled |
|---|---|---|---|
| Confounder | A factor that drives both spend and sales | Holiday demand raises budgets and purchases | Ads get credit for sales the season would have produced anyway |
| Mediator | A step a channel's effect passes through | Video raises branded search, which produces sales | Treating search as separate subtracts part of video's effect |
| Collider | A factor affected by two others | Site visits are driven by ads and by existing intent | Looking only at site visitors can make ads and intent seem related when they aren't |
Branded search is the example that matters most for most brands. It's both a channel you pay for and a path through which upper-funnel campaigns have their effect. A model has to know which role it's playing for which campaign, or it will either overcredit search or undercredit the video and social campaigns that fed it.
A causal graph also helps catch missing relationships. If a brand sells at Target and Walmart but the graph has no arrow from marketing to retail sales, every dollar of in-store lift goes uncredited.
Why many MMMs miss this structure
Many traditional and open-source MMMs don't use an explicit causal graph. They describe sales as a sum: a baseline, plus Meta, plus search, plus TV, each acting on revenue on its own. That flat structure creates three problems.
Spend that rises with demand can't be untangled
When marketing budgets and shopper demand peak together, the flat formula can split revenue many different ways and fit the past equally well. Without structure that says seasonality drives both, the answer comes down to the model's default settings. When holiday demand gets counted as ad performance, it's called baseline leakage. Prescient's peak-season simulations found two popular open-source approaches regularly inflating holiday effects, typically by a fifth to nearly a third.
Lower-funnel channels collect upstream credit
A flat formula has no arrows between channels, so it can't know that video drives branded search. When search conversions rise during an awareness push, search gets the credit. The campaigns that created the demand look weaker than they are, and recommendations push budget the wrong way.
Penalties and more data don't add missing structure
To keep a flat model steady, teams add statistical penalties or default starting assumptions. Those make results more stable, but they pick one answer among many that fit equally well rather than revealing which is right. More history doesn't fix it either, because the same ambiguity repeats in the new data. The model just grows more confident in whichever split its settings favor.
That doesn't make starting assumptions the villain—Prescient's model uses benchmark-based ones for channels with thin history—but they can't stand in for structure the model is missing.
Same revenue, very different credit
A quick example shows why fit alone can't tell you which model to trust. Two models explain the same $2 million month.
| Model A | Model B | |
| YouTube | $500,000 | $200,000 |
| Branded search | $250,000 | $550,000 |
| Other marketing | $250,000 | $250,000 |
| Baseline demand | $1,000,000 | $1,000,000 |
| Predicted total | $2,000,000 | $2,000,000 |
Both models match revenue exactly. Model A says YouTube is doing the heavy lifting, and Model B says branded search is. They'd lead to opposite budget decisions, and nothing in the totals says which is right. A causal graph that knows video feeds branded search rules out explanations that ignore that path.
How Prescient uses a causal graph
A causal graph is one of the structures underpinning Prescient's model, and it's used to enforce cause-and-effect relationships between marketing activity and outcomes. That graph sits inside a model that treats marketing as a connected system changing over time, rather than a set of independent slices.
The graph and the system work together on four things.
- Funnel direction. YouTube, CTV, and prospecting sit on the demand-building side of the graph, while branded search and retargeting sit on the converting side. Capture campaigns get credit for converting demand, and demand-building campaigns get credit for creating it.
- Effects across sales channels. Arrows run from marketing to every place a brand sells, so a Meta or CTV campaign can be credited for sales on your site, on Amazon, and at retailers. Prescient measures these as halo effects, sales a campaign drives by way of another channel or storefront.
- Timing. Effects build and fade on their own schedules, so a brand campaign can be credited weeks after it runs.
- Seasonal demand. The graph routes holiday surges and ad spend into one shared pool of shopper demand, so seasonal buyers aren't automatically logged as ad wins.
Prescient's model also doesn't force every channel's returns to level off at your past spending limit. Returns flatten only where results actually taper.
A simplified example: marketing and Amazon revenue
Here's how a simplified version of that structure might look for a brand selling on its own site and on Amazon. It's an illustration of the concept, not a full product diagram.
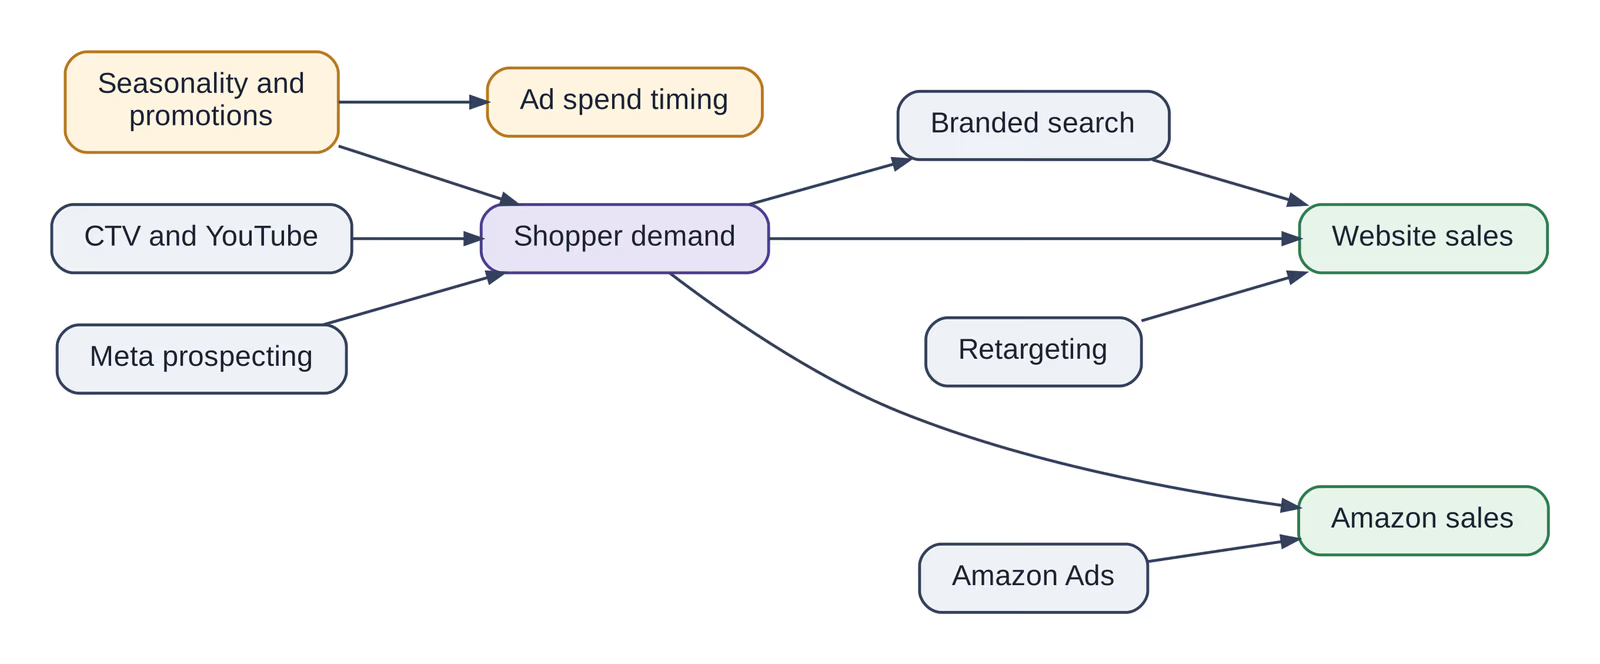
Read left to right, it says that upper-funnel campaigns and seasonality both feed shopper demand, that demand turns into sales in several places, and that capture channels like branded search, retargeting, and Amazon Ads convert demand at specific storefronts. A model built on this shape will credit CTV for Amazon sales it helped create, rather than handing all of them to Amazon Ads.
How traditional, open-source, and Prescient's MMMs handle structure
The three main types of MMM differ most in whether they write down how channels relate to each other.
| Question | Traditional MMMs | Open-source MMMs | Prescient's model |
|---|---|---|---|
| Causal structure | Usually implicit: channels added as independent slices | Independent slices by default; some libraries now offer options for funnel relationships | Causal graph plus a model of demand that changes over time |
| Demand creation vs. capture | Not distinguished | Not distinguished in standard setups | Built in |
| Seasonality driving spend and sales | Handled as a separate baseline | Handled as a separate baseline | Seasonal demand and ad spend modeled together |
| Effects across storefronts | Often limited to one revenue source | Depends on how the team builds it | Site, Amazon, and retail in one model |
| When spend and demand rise together | Answer depends on settings | Answer depends on penalties and default assumptions | Structure narrows the plausible answers |
| Return curves | Capped by design | Capped unless reconfigured | Flatten only where results taper |
What the peak-season research shows
The clearest test of structure is a peak season, when spend and demand surge in lockstep. Prescient built a synthetic market whose ideal Black Friday and Cyber Monday budget was known in advance, then asked its model and two popular open-source alternatives for a plan. (The work hasn't been peer-reviewed, and because many MMMs can't measure campaigns, scoring happened at the channel level.)
- One open-source approach recommended roughly 81% too much peak spend after treating holiday shoppers as ad results. The other recommended roughly 11.5% too little.
- Prescient's model missed the ideal by about 1%.
- Following the open-source plans would have given up about a third and nearly half of the achievable result. Following Prescient's would have given up about 6%.
Neither open-source approach struggled to reproduce history. Their misses came from how they divided credit, the exact gap a causal graph is meant to close.
What a causal graph can't do
A causal graph is powerful, but it isn't magic. Marketers should be skeptical of any claim that drawing a graph makes an MMM accurate by itself.
- It can't prove its own assumptions. Every arrow is a claim about how marketing works. A neatly drawn graph can still be wrong, and a missing arrow can bias results as much as a wrong one.
- It can't create information the data doesn't have. If two channels have always scaled up and down together, a graph can't separate them alone. Different timing, different funnel roles, or experiments are what give a model something to work with.
- It can't measure factors you don't track. Competitor promotions, cultural moments, and word of mouth can drive both spend and sales. A graph can acknowledge them, but if there's no data on them, some bias may remain.
- It doesn't size the effects. An arrow says YouTube affects branded search. It doesn't say by how much, how fast, or whether the effect is leveling off. That still takes estimation from good data.
- It can go out of date. Launching on Amazon, entering retail, or changing pricing can change how marketing drives sales. A graph that fit last year may not fit now.
- The data can't always pick the right graph. Different graphs can produce the same patterns in historical data. Business knowledge, timing, and experiments help decide between them.
Where incrementality tests fit
Incrementality tests and causal graphs answer different questions. A test measures what happened when spend changed in one place at one time. A graph describes how the whole system is believed to work. A test can support or challenge a model's estimates, but it reflects one region, season, and spend level, so it can't validate an entire graph on its own. In Prescient, a test can be added to the model as a prior, and you can see the model's accuracy with and without it before deciding whether it stays.
What to ask a vendor about its causal graph
You don't need to be a statistician to judge whether a provider takes cause and effect seriously. These questions will tell you a lot.
| Ask | What you're learning |
|---|---|
| Does your model use a causal graph, and how were its relationships chosen? | Whether the structure comes from business knowledge, data, experiments, or a mix |
| Which assumptions are fixed, and which can change for our business? | Whether the structure fits your channels and storefronts |
| How do you separate demand creation from demand capture? | Whether branded search and retargeting will collect upstream credit |
| Can the model show direct and indirect effects separately? | Whether halo effects and sales through other channels are measured |
| How do you account for seasonality driving both spend and sales? | Whether holiday demand will be counted as ad performance |
| What happens when an important factor isn't in the data? | Whether the provider is honest about limits |
| If two structures fit our history equally well, how do you choose? | Whether the provider understands the difference between fit and getting credit right |
| Beyond matching history, what checks do you run? | Whether stability checks, held-back test periods, and experiments are part of the process |
That second-to-last question is especially revealing. A strong answer will talk about business logic, timing, and outside evidence, not just which model scored best on history.
Where Prescient comes in
Because a causal graph and an evolving model of demand sit underneath it, Prescient's model lets credit follow the way marketing actually moves through your business. For omnichannel brands, that means one model across your website, Amazon, and retail partners, with Modeled ROAS for each campaign and halo effects that show where each campaign's influence lands.
Our Media Forecasting feature carries that structure into planning, so a proposed cut to brand video shows its effect on the branded search and Amazon sales it was feeding. To see the map behind your own channels, book a demo.
FAQs
What is a causal graph in marketing mix modeling?
A causal graph is a diagram that shows which factors in a marketing system influence which, using arrows that point from cause to effect. In marketing mix modeling, it encodes assumptions such as seasonality driving both ad spend and sales, or video ads increasing branded searches. Those assumptions shape how the model divides credit between channels.
What is the difference between a DAG and a causal graph?
A directed acyclic graph, or DAG, is the most common type of causal graph. "Directed" means each arrow points one way, from cause to effect. "Acyclic" means the arrows never form a loop. Effects that do loop in practice, such as sales influencing next month's budget, are represented by splitting them across time periods.
Does a causal graph make an MMM accurate?
Not on its own. A causal graph makes a model's assumptions explicit and helps it avoid common mistakes, such as crediting holiday demand to ads. But the graph can be wrong, it can't create information missing from the data, and it doesn't measure effect sizes. Accuracy still depends on good data, sound estimation, and validation.
Why does branded search cause problems in MMM?
Branded search is both a paid channel and a path through which other campaigns have their effect. People often search for a brand after seeing a video or social ad. Treat branded search as a stand-alone channel and it absorbs credit for interest the video or social ad actually sparked. A causal graph tells the model which campaigns feed branded search.
Do I still need incrementality tests if my MMM uses a causal graph?
They can still be useful as supporting evidence. A test measures what happened when spend changed in one place and time, which can help check a model's estimates. Because a test reflects only those conditions, it works best alongside an MMM rather than as a replacement for one.