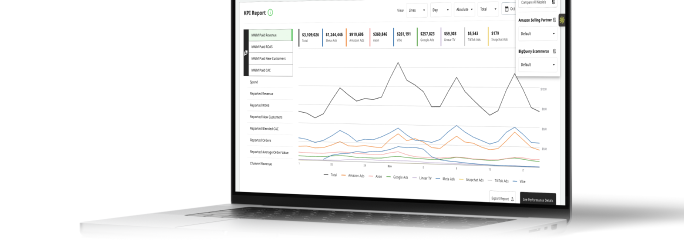




Why can you trust Prescient's MMM results?
Why can you trust Prescient's MMM results? No single metric proves any MMM, so here's the research and validation behind its numbers.
Linnea Zielinski · 8 min read

Before a jeweler weighs a customer's gold, she sets a certified weight on the scale, one whose exact mass is already known. If the scale reads 10.00 grams for a 10-gram weight, she can trust it with something she can't check another way. If it reads 10.4, she knows the scale is off before it costs anyone money.
Measuring marketing has the same challenge, minus the certified weight. In real data, nobody ever sees what sales would have been without a given campaign, so there's no answer key to check against. So, why can you trust Prescient's marketing mix model (MMM) results if there’s no equivalent to a certified weight? Not because any single number proves them. True incremental results can't be observed directly, so no MMM can be proven right in the real world. Trust has to be earned instead, through several layers of evidence: tests against known answers, research on real campaign data, checks against each brand's own sales, and room to bring in your own experiments.
That matters because campaign-level results are only worth acting on if you trust them, and blind trust is the wrong standard for any measurement tool. A number that looks precise but isn't will move real budget, and the decisions it drives are only as good as the evidence behind it.
Key takeaways
- No single metric can prove an MMM is right, because the true effect of each campaign can't be observed directly, so trust has to be built from several kinds of evidence.
- Platform-reported ROAS tends to overstate results because several platforms can claim the same sale, and traditional MMMs often can't separate individual campaigns.
- Prescient tested our MMM in a simulated environment where the correct answers were known, and ran the comparison at the channel level so it could include open-source MMMs that don't measure campaigns.
- In that research's peak-season results, our model’s recommended holiday budget missed the known best by roughly 1%, compared with misses of roughly 81% and 11.5% for two open-source approaches.
- Separate Prescient research on 20 real Facebook campaigns found that straight-line response fits beat the leveling-off curves many MMMs assume on most campaigns.
- For each brand, Prescient validates source data, compares modeled results with actual sales, and lets you add incrementality tests and see accuracy with and without them.
Why marketers don't trust platform ROAS or traditional MMMs
Most marketers have two sources of campaign performance, and neither is fully trustworthy. Ad platforms report generous numbers, and traditional MMMs often can't get down to the campaign level at all.
Ad platforms count the same sale more than once
Meta, Google, and TikTok each report on the sales they believe they influenced, and they often claim the same purchase. It's not unusual for platform-reported revenue across channels to add up to more than a brand actually sold. Branded search and retargeting tend to look best of all, because they reach people right before checkout. That puts them in line for credit that belongs to the video or prospecting campaign that introduced the brand days earlier.
Traditional MMMs stay at the channel level
Traditional MMMs avoid that double counting, but most struggle to separate individual campaigns, especially when several run at the same time. To keep the math stable, they group campaigns into channel totals like "Meta" or "Google." That's useful for broad planning, but it doesn't tell you which campaign to scale or cut this week.
The result is a frustrating choice between inflated platform numbers and averages too broad to act on.
How you can test an MMM when the true answer is hidden
The core problem with validating any MMM is that real-world data has no answer key. You can't rewind a quarter and rerun it without a campaign to see what changed. A model can match your past revenue almost perfectly and still give credit to the wrong channels, because many different splits of credit add up to the same total.
The way around that is to test the model somewhere the answers are known. Prescient built a simulated marketing environment with its own shoppers, seasonality, and holiday spikes, plus a simulated marketer who raised and lowered budgets strategically, the way real teams do. Every channel's true contribution was known, so each model's answer could be scored directly.
The environment was designed to be hard on purpose. It included overlapping campaigns, spend that rose alongside holiday demand, upper-funnel activity that fed lower-funnel channels, and efficiency that changed with the season. Some response patterns were deliberately ones that no model in the test, our own included, was built to match perfectly. The research, published by Prescient, ran across 10 independently generated datasets.
Evidence from the peak-season test
Peak seasons are the toughest stretch for any MMM, since budgets and shopper demand climb in the same weeks. They're also where the research's results are most decision-relevant, since that's when the year's largest budget calls get made.
| Model | Its BFCM budget compared with the known best | Results left on the table if you followed it | Peak-lift prediction error (sMAPE, lower is better) |
|---|---|---|---|
| Open-source regression MMM | Roughly 81% over | Roughly 32% | 0.56 |
| Open-source Bayesian MMM | Roughly 11.5% under | Roughly 45% | 1.06 |
| OMEN | Roughly 1% off | Roughly 6% | 0.28 |
Each miss had a clear cause:
- The regression model gave ads credit for shoppers the holidays would have delivered anyway, so it called for far too much spend.
- The Bayesian model capped marketing's potential too low and held back.
- Across runs, both open-source models also inflated the size of holiday effects, commonly by a fifth to nearly a third, while our model's read on seasonal demand tracked the truth closely.
Both open-source models fit past sales well. Their mistakes only showed up because the correct answers were known, which is exactly why this kind of test matters.
Evidence from real campaign data
The simulated test checks structure. A second Prescient study looked at how real campaigns respond to spend. It analyzed 20 Facebook campaigns from one brand, about 3,500 days of campaign data in total, from before Apple's iOS 14.5 update weakened tracking.
The question was whether campaign returns really level off the way most MMMs assume. For each campaign, the study compared two common leveling-off curves, Hill and Weibull, with a straight line, all measured against a flexible baseline fitted to the data itself.
| Response shape | Average error against the data |
|---|---|
| Straight line | About 33% |
| Hill curve | About 53% |
| Weibull curve | About 331% |
The straight line fit best on most of the campaigns. That matters for campaign-level results because a model that forces every campaign onto a leveling-off curve will understate the returns of campaigns that still have room to grow. Prescient’s MMM doesn't impose that shape. It shows a campaign's returns leveling off only where the data supports it.
How campaign-level results build on that evidence
Prescient's campaign-level results come from the same model structure that was tested at the channel level, with extra safeguards for the added detail. Campaigns aren't estimated in isolation. Prescient first learns stable patterns at broader levels, then estimates individual campaigns within that structure, so a campaign's results stay consistent with how its channel is performing.
That structure also handles the credit problem that inflates platform ROAS. Prescient’s model knows a prospecting video and a branded search ad do different jobs. The video builds interest; the search ad catches people who already have it. So a branded search campaign is credited for closing the sale, and the video that sparked the search is credited too, through halo effects: sales a campaign produces by way of some other channel.
Not every campaign gets its own estimate, either. Prescient only breaks out campaigns with a minimum spend history (seven days with spend within the last 12 months), which stops a brand-new or barely funded campaign from producing a precise-looking figure built on almost nothing.
Evidence from your own data
Research builds confidence in the approach. For your brand specifically, trust should come from your own data, and Prescient's stance is to trust but validate. Here's how your results get checked.
- Validated inputs. Before the first model run, you confirm that the synced sales, ad, and analytics figures match your own records.
- Fit to your actual sales. Prescient compares modeled total performance with your reported business results and tracks the gap over time with sMAPE, a standard measure of forecast error.
- Model comparison. Different model setups can be reviewed side by side, so the one chosen is the one that reflects your business most realistically, not just the one with the best headline fit.
- Forecasts checked against results. After you act on a projection, Prescient lines up the forecast against your real results across several weeks, not one unusual day.
- Confidence on every forecast. Projections show a likely range plus a confidence rating, which drops when you're planning at spend levels your history doesn't cover.
Bringing your own experiments
Teams that run geo-lift studies or holdouts don't have to choose between their test and their MMM. Prescient can fold a test in as a prior, then report how accurate the model is both ways—with the test and without it—so the effect of adding it is visible.
If adding the test sharpens the overall fit, that's a strong signal. If it pulls against everything else in your data, that's worth knowing too, and the call on keeping it is yours. Because any single test reflects one region during one window, it works best as supporting evidence.
Comparing your attribution options
The three most common sources of campaign performance answer different questions, and they hold up differently under scrutiny.
| Ad platform ROAS | Traditional MMM | Prescient's Modeled ROAS | |
| How it measures | Clicks and tracked conversions on that platform | A sum of independent channel effects | One model of how channels create and capture demand |
| Shared sales | Several platforms can claim the same sale | Not double counted | Not double counted |
| Level of detail | Campaign | Usually channel | Channel, tactic, and campaign |
| Upper-funnel campaigns | Undercounted, since few people click right away | Often under-credited | Credited for downstream sales through halo effects |
| Peak seasons | Claims holiday sales it didn't drive | Can mistake holiday shoppers for ad results | Landed near the best budget in peak-season research |
| How it's checked | Not independently verified | Usually fit to past sales | Known-answer research, fit to your sales, and optional test priors |
Where Prescient comes in
For omnichannel brands, Prescient reports Modeled ROAS campaign by campaign across the website, Amazon, and retail partners, folds in halo effects and retail halo effects, and refreshes every day. Underneath it is our model that was tested against known answers in peak-season conditions before being trusted with real budgets.
The best evidence is still how it performs on your data. You can pressure-test results against your own records, add your experiments, and compare forecasts with what actually happens before you scale anything. If you'd like to see that process with your own campaigns, book a demo.
FAQs
How do you know if you can trust an MMM's results?
No single test settles it, because the true effect of each campaign can't be seen in real-world data. Trust is strongest when several kinds of evidence point the same way: testing in simulated environments where the answers are known, checks against your own sales, stability across reasonable model settings, and, where available, results from incrementality tests.
Why is platform-reported ROAS higher than MMM results?
Ad platforms each claim credit for the sales they touched, so the same purchase can be counted by several platforms at once. They also favor channels that reach people right before checkout. An MMM works from total spend and sales across all channels, so each sale is counted once and divided among the channels that drove it.
Why test an MMM on simulated data?
Simulated data is the only place where the true answer is known. Building a realistic environment with overlapping campaigns, seasonal spikes, and strategic budget changes lets researchers score each model's answer directly. In real data, a model can fit past sales well and still divide credit incorrectly.
Can incrementality tests confirm campaign-level results?
They're helpful supporting evidence rather than the final word. A test captures a single change in a single market during a single window, and that result may shift in another season or at a different budget. In Prescient, you can add the test as a prior and compare model accuracy both ways to see whether it agrees with the rest of your data.
The Halo
Exclusive insights, every week.
Subscribe to The Halo for sharper marketing thinking.
You're subscribed to The Halo!
Quick question (optional): How familiar are you with MMM?
Thanks for sharing! Enjoy The Halo.
Keep reading
View all
How does MMM measure halo effects across sales channels?
Read article
How does MMM handle correlation?
Read article
A marketer’s guide to in-house MMM builds vs vendor tools
Read article
How many channels can an MMM measure?
Read article
Can MMMs measure campaigns, or only channels?
Read article
How do MMMs work? What happens between your data and your budget recommendation
Read article