




Welcome back to The Halo. In this issue we cover:
Industry Watch: The IAB (Interactive Advertising Bureau) just confirmed what most measurement teams already feel.
The Take: How DECKED found their worst-reported tactic was actually their best.
From the Blog: The structural reason last-touch over-credits the wrong tactics.
Prescient Voices: Taylor Straley, VP of eCommerce at DECKED, on the budget decision that changed.
Three Things: Reads on halo measurement, awareness budget defense, and the campaign-level question.
This week's issue opens with a stat from the IAB and lands on a case study that puts a face on it.
The IAB State of Data 2026 report finds that up to 75% of U.S. buy-side leaders say their core measurement methods are underperforming. DECKED, a high-AOV truck-accessories brand, is what that 75% looks like when it gets resolved.
The tactic their dashboards ranked last across the entire account, “Awareness”, turned out to be their best on true incremental contribution. The tactic dashboards loved, retargeting, held under 3% of its reported return once modeled.
Welcome to The Halo. Each week: one piece of measurement analysis, the best of the blog, one real customer result, and three reads worth your time. This week, a new section: Industry Watch, where we surface one piece of category news that connects to the issue’s main story.
Let’s dive in.
INDUSTRY WATCH · NEW
75% of buy-side leaders say their measurement isn’t working
The IAB’s State of Data 2026 report, published this quarter, surveys U.S. buy-side leaders on what is and is not working in their measurement stack.
Up to 75% report that core methods (attribution, incrementality, MMMs) are underperforming.
Last-touch over-credits the channels that close. Standard MMMs generalize across categories instead of modeling the brand. Platform reporting is optimized for platform incentives, but not for the marketer trying to allocate the next dollar.
This week’s Take is what the 25% looks like in practice. DECKED’s case study is one brand seeing past those three failures, with numbers that show exactly how far the dashboard view was from the modeled truth.
Source: IAB State of Data 2026. Read the IAB session on modernizing MMM, attribution & incrementality →
01 · THE TAKE
How DECKED found their worst-reported tactic was actually their best
THE INVERSION
DECKED builds truck-bed storage and cargo systems for people who treat their trucks as tools. Products are durable, premium, and high consideration. Customers research, compare, watch how-it-works content, and come back weeks later to buy. The journey is long. The AOV is high.
The native platform dashboards were confident about which tactics worked. Retargeting reported some of the highest returns in the account. Upper-funnel awareness sat at the bottom of the labeled tactics. It looked like a hole in the budget.
WHAT THE MODEL SAW
DECKED ran their data through Prescient’s MMM, which separates each tactic’s real contribution from the revenue that would have happened anyway. Base revenue, the demand a channel captures, gets split from halo revenue, the downstream and cross-channel lift it creates.
The picture inverted.
The awareness tactic was the most efficient tactic in the account, 4x more efficient than retargeting on true incremental contribution. It was capturing only about a third of its real value in the platform view. Modeled out, it returned roughly three times the credit dashboards gave it.
Retargeting, the dashboard favorite, held under 3% of its reported return once modeled. It was largely harvesting demand that already existed and claiming the sale.
Most of what it appeared to drive was already going to convert!
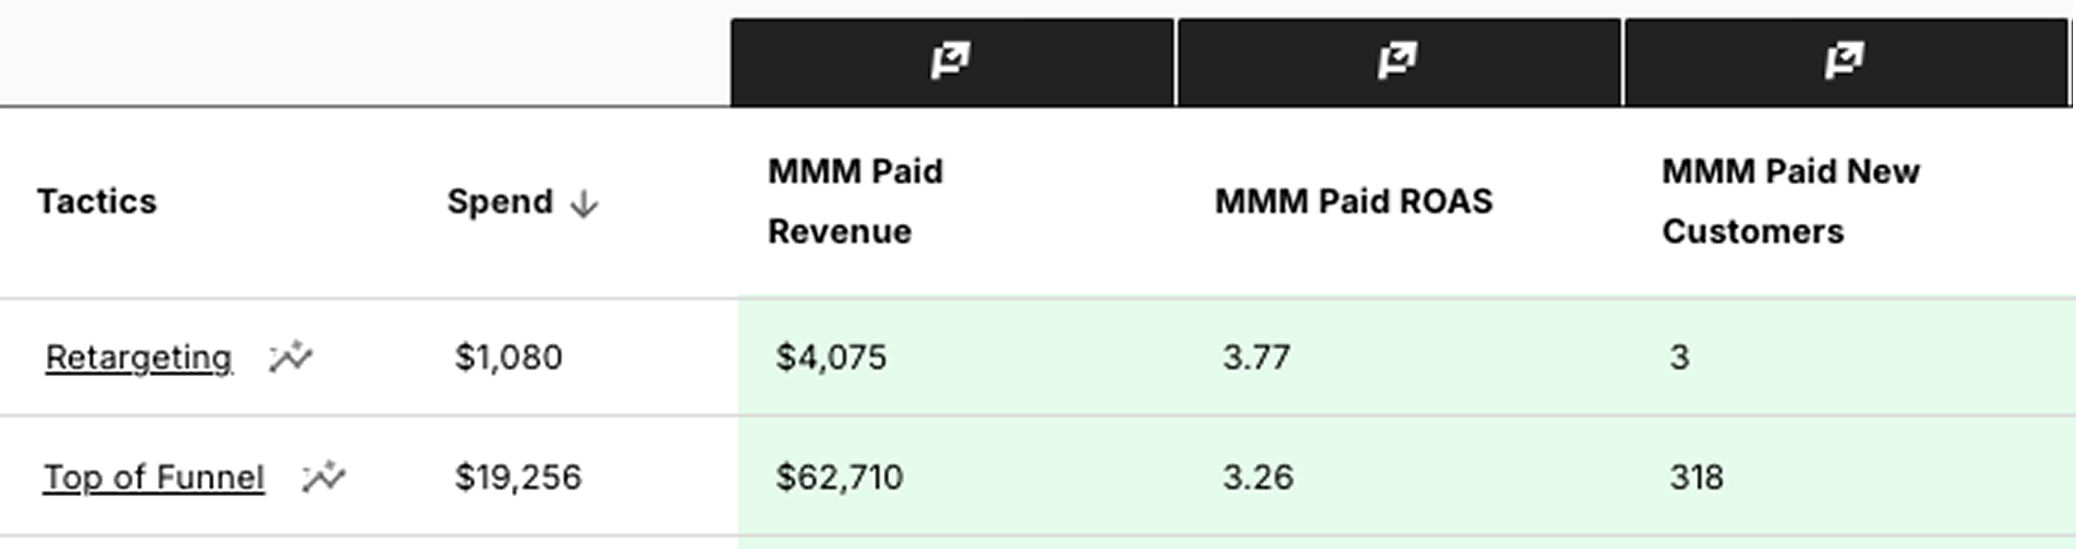
Example of the tactic view in Prescient. Demo numbers, not DECKED’s.
WHERE THE VIDEO HALO LIVED
The channel-level view explained why. DECKED’s video channel reported almost exactly what Prescient modeled, within about 1%. The total was close. The distribution was completely different.
About 95% of that video channel value was halo: lift that lands later and on other channels. A last-touch view sees the magnitude but never the mechanism. The channel carrying the most real efficiency was the one a dashboard could never fully credit.
A heavily-used search channel told the opposite story, holding only about 6% of its reported return once modeled.
WHY THIS KEEPS HAPPENING
The DECKED inversion is what the IAB’s 75% number looks like up close. Last-touch dashboards are not slightly off. For specific tactics in high-AOV portfolios, they can be directionally wrong, ranking the most efficient tactic last and the least efficient tactic first.
For DECKED’s growth team, the win was not a budget reallocation. The win was seeing clearly. Once the scoreboard was accurate, the strict efficiency target was reachable for the first time.
02 · FROM THE BLOG
The hidden cost of cutting awareness spend
Cutting awareness spend looks safe on paper. The platform dashboards always rank it low. The reported ROAS rarely justifies the line item. The post walks through why those signals are systematically misleading for awareness, how the lost value shows up months later as eroded organic traffic and a dropping conversion rate, and what to do instead.
• Why last-touch dashboards understate awareness by construction.
• How an awareness cut compounds back as a revenue hole one or two quarters later.
• What measurement architecture actually reveals upper-funnel contribution.
The piece is the structural companion to this week’s Take. DECKED’s near-miss with cutting awareness is the lived version of every argument it makes.
03 · PRESCIENT VOICES
We were proud of how efficiently we ran our media, but we always had a nagging feeling our awareness work was doing more than our reporting could show. Prescient finally put a real number on it. Seeing that the tactic our dashboards ranked last was actually our most efficient once you measured true contribution changed how we think about every budget decision.

04 · THREE THINGS WORTH READING
1. Understanding marketing halo effects and halo impact
The technical foundation for the entire DECKED case. Halo effects happen when one channel drives conversions that close on another. Last-touch attribution by definition cannot see them. The post explains what halo is, why it is invisible to platform dashboards, and how to measure it across channels.
2. How your bottom of funnel is driven by your top of funnel
The POV companion to DECKED’s inversion story. Bottom-funnel efficiency depends entirely on a healthy top of funnel. Cut the top, and the conversion engine starves within weeks. DECKED’s awareness sat at the bottom of the labeled tactics for years. This is what they were betting on when they trusted their hunch.
3. Why top-of-funnel keeps losing the budget argument
The structural critique behind the IAB number from Industry Watch. Last-touch made sense in a world of one device, one path, and tight conversion windows. None of that describes a 2026 high-AOV portfolio.
The Halo
Exclusive insights, every week.
Subscribe to The Halo for sharper marketing thinking.