



Welcome back to The Halo. In this issue we cover:
The Take: Why Global Healing almost cut the channel that turned out to be #1.
From the Blog: Why platform attribution buries channels that close on other surfaces.
Discovery of the Week: How YouTube went from #9 to #1, and scaled 8.4x without losing efficiency.
Prescient Voices: What stays invisible when the platform only counts what closes on its own surface.
Three Things: Reads on Amazon halo, view-through measurement, and brand archetype thinking.
This week, the same pattern from the past two issues shows up on a channel almost every brand runs: YouTube. And at a brand that came close to cutting it.
Global Healing, a Houston supplements company, runs nine paid channels across DTC and Amazon. Their platform dashboards ranked YouTube dead last, #9 of 9, driving almost no revenue.
Instead of cutting it, they increased the spend on the channel. It was the single largest revenue driver in the portfolio. The revenue was hidden.
Welcome to The Halo. Each week: one piece of measurement analysis, the best of the blog, one real customer result, and three reads worth your time.
Let's dive in.
01 · THE TAKE
How Global Healing found one of its highest-performing channels with Prescient
THE CHANNEL RANKED LAST WAS ACTUALLY FIRST
By platform attribution, YouTube was Global Healing's worst channel. Last of nine, close to zero attributed revenue. Amazon Ads and Google Search claimed more than half of all attributed sales, and scaling them was the obvious next step.
You can probably guess the question on the table: why keep YouTube running if it is underperforming?
Global Healing did not cut it. They went looking for a more granular view of how YouTube was affecting revenue across every storefront first.
WHAT THE MODEL SAW
So they ran 24 months of daily data through Prescient's MMM.
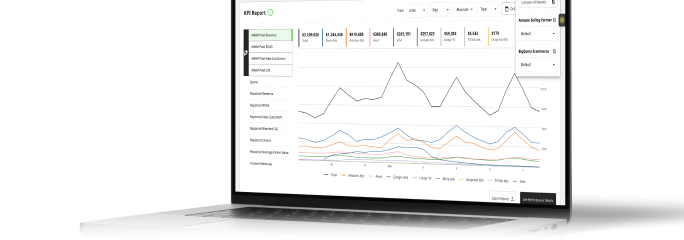
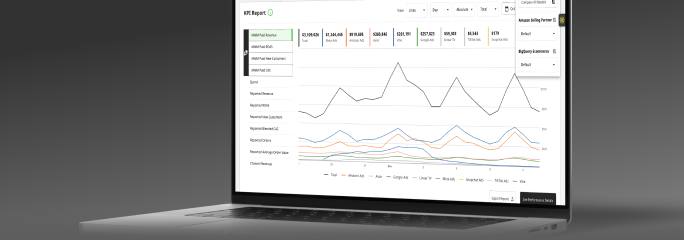
The picture inverted. YouTube ranked #1, not #9, once the model could see where its value landed.
No dashboard could see why:
• 64% of YouTube's modeled revenue landed as Amazon purchases.
• Another 28% landed on the DTC site.
• 8% on indirect ecommerce halo.
YouTube was creating the demand that other channels were getting credit for closing.
THE 8.4x SCALE-UP
With the model behind them, Global Healing scaled YouTube spend to 8.4x its baseline, this time with a data-backed case behind the budget.
Efficiency did not break at higher spend. It held and improved. As spend scaled, the Amazon halo grew with it: 49% of YouTube's value while testing, 53% while building, 67% once fully scaled. Amazon's share of total revenue moved from 52% to 62%.
And overall weekly revenue grew about 21% across the scaling phase.
WHY THIS KEEPS HAPPENING
You have now seen this pattern three weeks running. A channel that creates demand without closing it on its own surface will always look weak in platform reporting, because the channel's native platform only counts what closes on its own surface.
The value is real. It just lands somewhere the dashboard cannot see.
The channel Global Healing almost cut was the one holding up the channels that looked like winners. If that sounds familiar, the full case study is worth the read.
02 · FROM THE BLOG
Why top-of-funnel spend keeps losing the budget argument (and how to fix it)
Top-of-funnel channels create demand that closes somewhere else. Native dashboards credit the close, not the influence that drove it. The post walks through why top-of-funnel keeps losing the budget conversation, even when it is doing the heaviest lift.
• Native dashboards credit the close, not the impression.
• View-through value disappears when the close happens on another surface.
• The argument changes when the model can see the full path from impression to revenue.
The piece is the technical companion to this week's Take. Global Healing's YouTube case is the worked example of every claim it makes.
03 · PRESCIENT VOICES
In the past, marketing has largely been plagued by inconsistent and unreliable attribution, leaving teams feeling either inflated or deflated from performance. Today, the expectation for quick, insightful, and most importantly accurate data has never been higher.

04 · THREE THINGS WORTH READING
1. How to measure MNTN performance TV campaigns
MNTN runs the same structural problem as YouTube. Impressions land on connected TV, purchases close on the brand's site or somewhere else entirely. The post breaks down how to measure a channel where the close happens off-platform, and what to do when platform-reported ROAS understates the contribution.
2. 8 critical omnichannel marketing best practices for modern brands
Global Healing operates the way most omnichannel brands do, with revenue split between DTC and Amazon and channels feeding both. The post catalogs the operational practices that make omnichannel measurement work: data integration, cross-storefront tracking, and the planning rhythm that keeps it running.
3. What sales uplift is, how to measure it, and why your numbers might be off
This week's Take rests on a single technical claim: the modeled uplift of YouTube was far higher than its platform-reported uplift. The post is the primer on what sales uplift actually is, how the standard tools measure it, and the systematic ways those measurements can be wrong.
The Halo
Exclusive insights, every week.
Subscribe to The Halo for sharper marketing thinking.