




Attribution
See what each channel drove directly and what it lifted elsewhere, Base and Halo, on one exportable page. Compare modeled ROAS with platform-reported ROAS by channel.
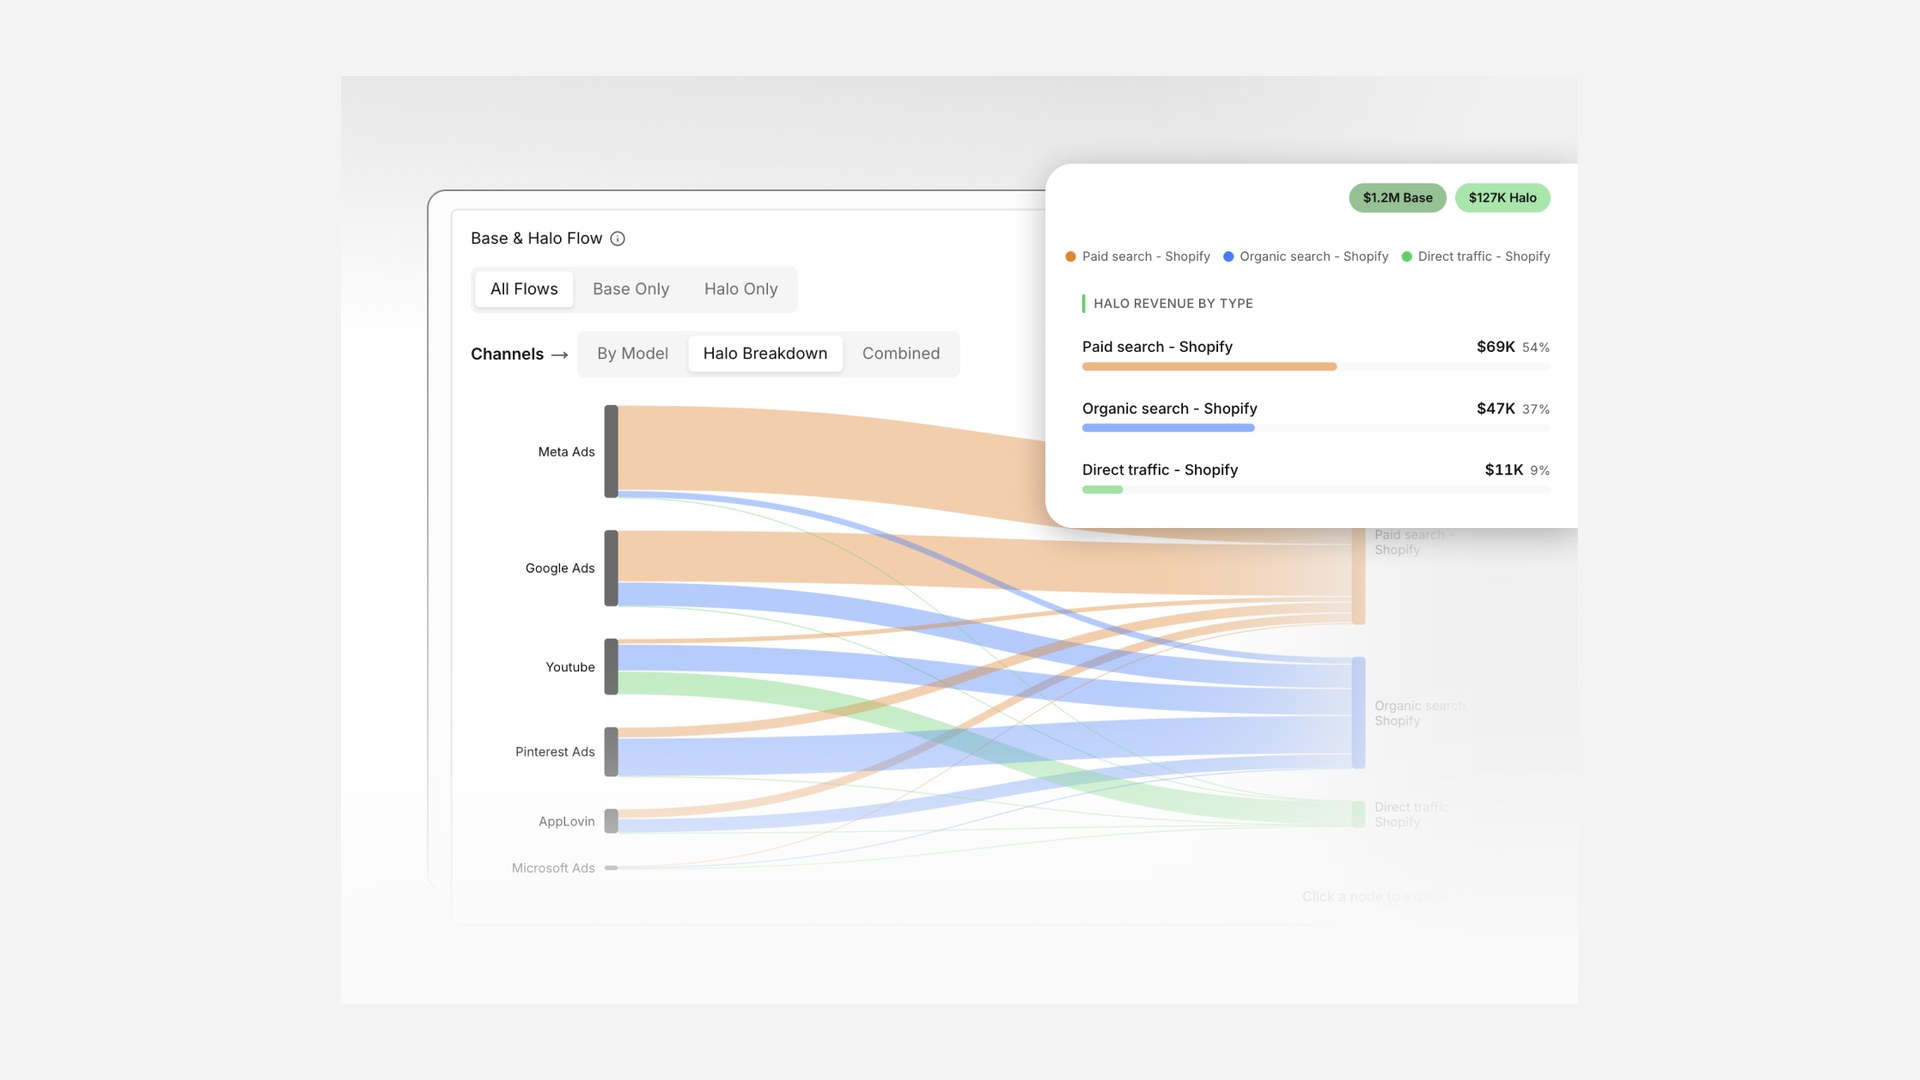
Attribution pulls reporting that used to be split across Home and Performance into a single cross-model view. It separates what each channel drove directly from what it lifted somewhere else, which is usually where your modeled ROAS and the platform-reported number part ways.
Base and Halo, side by side
Base is the direct, first-order demand a channel drives. Halo is the second-order lift it creates elsewhere, the demand that lands on Amazon, retail, or another channel. Add them and you get the MMM total, shown right next to the platform-reported number, so the gap between the two is easy to read. Five cards up top summarize the view.
Revenue or new customers
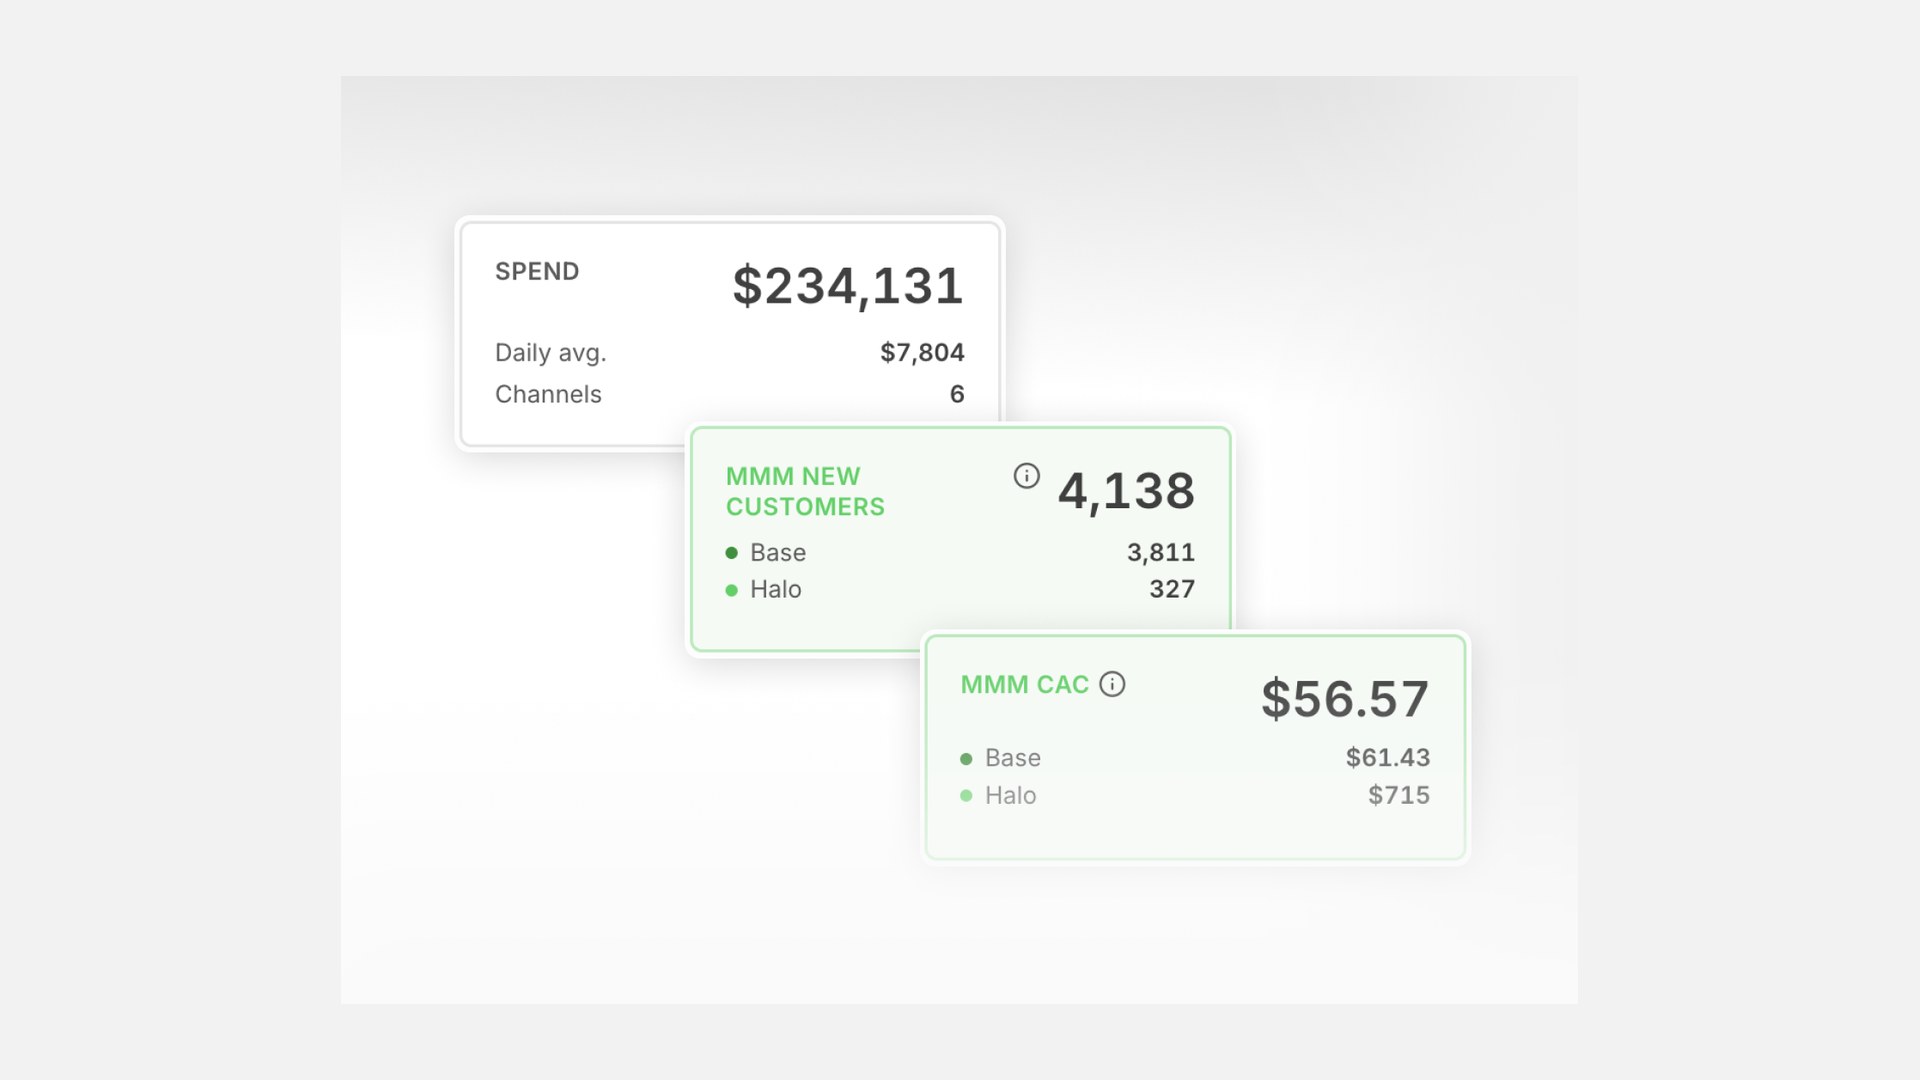
Read it in revenue terms, spend, MMM revenue, Base and Halo splits, and MMM ROAS across any date range. Or flip to New Customers, and the same page shows CAC and acquisition, split the same Base and Halo way.
Follow the flows
A flow diagram traces contribution By Model, as a Halo Breakdown, or Combined, filtered to All, Base Only, or Halo Only. The spend and metric time-series carry Compare and Breakdown controls.
Drill in and export
The performance table breaks out into Channels, Tactics, and Campaigns tabs, all sortable, with a column picker, row drill-downs, and date compare. Export any of it to CSV when you need the numbers in a planning meeting.
Part of Prescient Horizons.