



What is advertising analytics? A guide to tracking ad performance that drives decisions
Advertising analytics means more than platform dashboards. Here's what it covers, where it breaks down at scale, and how to build a stronger approach.
Linnea Zielinski · 9 min read
A sound engineer running a live mixing board doesn't crank every channel to full volume and call it a good show. Each fader controls one instrument, and the actual skill is knowing how those instruments sound together, not how loud any single one gets on its own. Marketing teams running ad campaigns across search ads, social ads, and display ad placements are working the same kind of board. Every advertising platform hands back its own reading on "how you're doing," and no single channel tells you what the whole mix actually sounds like.
Despite the platform hurdle, it pays for teams that master advertising analytics. The teams that can turn scattered platform numbers into clear next steps spend their advertising budget more efficiently, and teams that can't end up guessing where the next dollar of ad spend should go. Here's what advertising analytics actually covers, where most marketing teams get stuck, and what a stronger approach looks like.
Key takeaways
- Advertising analytics is the process of collecting and interpreting advertising data to guide ad campaigns and budget allocation.
- A handful of key metrics, like click through rate, CPA, and ROAS, matter more than the dozens of custom metrics teams often track.
- Manual reporting across multiple advertising platforms becomes unsustainable as ad spend and creative volume grow.
- Advertising platforms can only report on what happens inside their own walls, which means they miss cross channel effects.
- The real bottleneck for most marketing teams isn't collecting performance data, it's turning that data into fast, confident decisions.
- First party data matters more every year as cookie based tracking keeps eroding.
- A complete advertising analytics approach layers platform reporting with analytics tools built to see across your entire advertising ecosystem.
What advertising analytics actually means
Advertising analytics is the practice of collecting, organizing, and interpreting data from your ad campaigns to understand what's working and guide where budget goes next. That spans everything from basic metrics like click through rate and cost per click, up through more advanced analytics that try to model how spend on one advertising channel affects results somewhere else.
For most marketing teams, advertising analytics starts inside the ad platform itself. Google Ads, Meta, and TikTok all offer their own dashboards showing impressions, clicks, and conversions tied to your search ads, display ad campaigns, and social placements, and most marketing analytics programs lean on Google Ads reporting as a starting point simply because so much spend runs through it. Website analytics tools like Google Analytics add another layer, tracking user behavior after someone clicks through to your landing pages, and pairing Google Analytics with platform-level reporting is usually the first real step toward a functioning advertising analytics tools stack. Together, these analytics tools make up the foundation most marketing teams build on, whether the work happens in-house or through an advertising agency.
The goal of advertising analytics isn't just to look backward at historical data, though. The best programs use that data to inform decisions about ad placement, creative direction, and budget allocation going forward, connecting what happens on one channel to what actually moved people from awareness to purchase. That's the difference between analytics as a reporting exercise and analytics as a genuine business tool that helps teams maximize ROI on every dollar of digital marketing spend. Good advertising analytics also shifts with market trends, since the channels and tactics that worked last year rarely stay static for long.
The metrics worth tracking
Before diving into fundamental metrics, it helps to separate two different jobs they do. Some metrics tell you whether an ad is catching attention, while others tell you whether that attention is turning into revenue. Too many teams confuse the two when reviewing campaign performance.
Attention and engagement metrics:
- Click through rate (CTR): the percentage of people who saw your ad and clicked on it, a quick read on whether your creative and targeting are resonating with your target audience
- CPM: what you're paying per thousand impressions, useful for comparing costs across different advertising channels
- Bounce rate: how many people leave your landing pages without taking further action, which can signal a mismatch between the ad and the page it sends people to
Outcome and efficiency metrics:
- CPA (cost per acquisition): what it costs to generate one conversion, whatever you've defined that to be
- ROAS (return on ad spend): revenue generated for every dollar spent, one of the most common performance metrics for judging whether a campaign is helping you maximize ROI
- CAC (customer acquisition cost): the fully loaded cost of acquiring a new customer, often tracked alongside customer lifetime value to judge whether that acquisition cost is worth it over time
Most marketing teams don't need custom dashboards packed with advanced metrics to get value out of advertising analytics. A handful of consistent basic metrics, tracked the same way over time, usually tells you more than a sprawling list of numbers nobody has time to review. That said, more sophisticated tools do add value once you're ready for it. Cohort analysis, custom events, and audience segments can offer deeper insights into which parts of your target audience are actually driving results, and real time campaign performance data helps catch problems before they burn through budget.
Where advertising analytics breaks down at scale
Tracking a handful of metrics for a couple of ad campaigns is manageable with a spreadsheet and an hour on a Friday afternoon. That process doesn't hold up once ad spend and creative volume grow.
- Manual reporting doesn't scale. Logging into three or four advertising platforms every week to copy numbers into a sheet eats hours that could go toward actual strategy work.
- More creative means more noise. Teams producing a dozen or more new ads each week across search ads, display ads, and social media end up drowning in advertising data instead of finding the handful of ad copy variations that actually moved the needle.
- Each platform grades its own homework. The numbers you see in an ad platform's dashboard reflect that platform's own attribution logic, not a neutral measure of what your advertising campaign actually did.
None of this means advertising analytics stops mattering as you scale, or that you need an army of data scientists to keep up. It means the manual, platform-by-platform version of it stops being realistic.
From data collection to decision-making
The bottleneck for most marketing teams isn't a lack of performance data. It's usually the opposite: too much time spent gathering numbers and too little spent deciding what to do with them. A few shifts tend to help teams turn advertising data into valuable insights instead of a backlog of spreadsheets.
Reviewing performance by angle or concept, rather than by every individual creative, cuts down on wasted analysis. If five ad variations share the same core hook but different production styles, the useful question is whether that hook worked with your target audience at all, not how each individual version performed down to the decimal point.
Setting clear thresholds ahead of time also helps. Deciding in advance what counts as a genuine winner or a genuine loser means less time gets spent debating advertising campaign performance that landed somewhere in the unremarkable middle. And consolidating advertising platforms into one custom dashboard, rather than switching between four different logins, turns a multi-hour weekly review into something closer to twenty minutes, freeing up time to actually allocate resources and turn campaign performance data into valuable insights instead of another spreadsheet nobody revisits.
This is also where a platform built specifically to help marketers turn historical data into confident decisions about where to cut and where to scale starts to matter. That's the gap Prescient was built to close, and it's worth walking through why platform-level data alone can't get you all the way there.
Why platform-level data only tells part of the story
Even a well-run, consolidated view of your advertising platforms has a ceiling. Platform dashboards are built to report on activity inside their own walls, and that creates two related problems for anyone trying to understand true advertising performance.
The first is visibility. A paid social ad can drive someone to search your brand name later, buy directly, or purchase through Amazon days after seeing it, and none of that shows up in the platform that served the original ad. These cross channel effects, sometimes called halo effects, are real revenue your ad campaigns generated, but they're invisible to any single platform's analytics tools. (This is why cross channel marketing requires more modern marketing measurement.)
The second is bias. Advertising platforms have their own incentive to show strong numbers for the ads running on them, which is part of why platforms like Google and Meta have faced public questions about how their reported numbers get calculated. That doesn't mean platform data is useless. It means it works best as one input among several, not as the final word on whether an advertising campaign worked.
Building a more complete advertising analytics approach
None of this means starting over. It means building on the platform-level tracking most teams already have.
Start by consolidating reporting into one place so your data team, or whoever owns this process, isn't logging into separate advertising platforms every week. From there, define a short list of key metrics that actually inform decisions for your business goals, and resist the urge to track everything just because a platform makes it available. Clean, consistent first party data becomes more valuable here too, especially as third party tracking keeps getting less reliable and market dynamics keep shifting how much can be tracked at all.
The last layer is analytics tools that can see beyond any one advertising platform. That's where a broader view of cross channel performance, one built to capture how spend across your entire advertising ecosystem adds up to revenue rather than just what happened inside a single ad platform, starts to pay off. Understanding how spend on one channel shows up as results somewhere else, and how that shifts with broader market trends, is what separates advertising analytics that just reports numbers from advertising analytics that actually informs strategy.
Where Prescient comes in
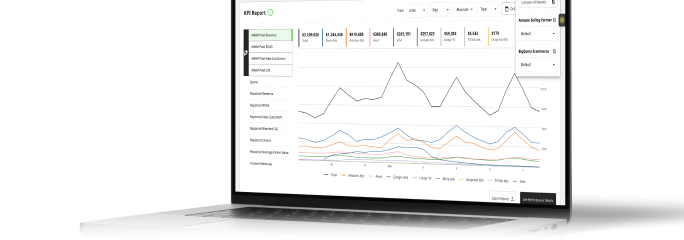
Prescient was built to sit above platform-level reporting and show marketing teams the full impact of every advertising campaign, including the cross channel and halo effects that platform dashboards can't see on their own. Instead of asking your data science team to stitch together numbers from Google Ads, Meta, TikTok, and Amazon by hand, Prescient's marketing mix model brings all of it into one place, updated daily, so your team can see how spend on one advertising channel is actually showing up as revenue somewhere else entirely.
That matters because the platforms reporting on your advertising performance have their own version of the story to tell, and you deserve a report that doesn't. Prescient gives marketing teams a neutral, cross channel view of what's actually driving revenue, so decisions about advertising budget and advertising efforts can be based on real performance data instead of numbers each platform has an incentive to inflate. Book a demo to see what a more complete view of your advertising analytics looks like.
FAQs
What's the difference between advertising analytics and marketing attribution?
Advertising analytics is the broader practice of tracking and interpreting performance data across your ad campaigns, things like click through rate, CPA, and ROAS. Marketing attribution is more specific: it's the method used to decide which channels or touchpoints get credit for a given conversion. Attribution is one input into advertising analytics and marketing analytics more broadly, not the whole picture.
What tools do businesses typically use to track advertising performance?
Most marketing teams start with the reporting built into each ad platform, alongside a web analytics tool like Google Analytics to track on-site behavior. As advertising channels multiply, many teams add data visualization or dashboard tools to consolidate everything in one place, and some layer on more advanced analytics, like marketing mix modeling, to understand cross channel impact.
How often should marketing teams review ad performance data?
Weekly reviews are common, especially for teams launching new creative regularly, but the right cadence depends on how quickly your ad campaigns generate enough data analytics to draw conclusions. Reviewing too frequently can lead to reactive decisions based on normal day to day fluctuations in consumer behavior rather than real market trends.
Can advertising analytics predict future ad performance, or only measure the past?
Traditional advertising analytics tools are largely backward looking, showing you what already happened. More advanced analytics approaches, particularly marketing mix modeling, can help forecast how future budget allocation is likely to perform based on historical data and response patterns, which is part of why more marketing teams are adding them to their measurement stack.
The Halo
Exclusive insights, every week.
Subscribe to The Halo for sharper marketing thinking.
You're subscribed to The Halo!
Quick question (optional): How familiar are you with MMM?
Thanks for sharing! Enjoy The Halo.
Keep reading
View all
How do MMMs work? What happens between your data and your budget recommendation
Read article
Prescient vs. last-click: What your attribution model can't see
Read article
How to measure effectiveness of awareness campaign performance
Read article
How retargeting pixels work and what they can't tell you
Read article
How full path attribution model works and when it's worth using
Read article
How a W-shaped attribution model works and when to use it
Read article